 Global| Sep 07 2004
JOLTS July Update: US Hiring Improved But Slower
by:Tom Moeller
|in:Economy in Brief
Summary
The Job Openings & Labor Turnover Survey (JOLTS) from the Bureau of Labor Statistics for July continued to indicate improved hiring, but at a slower rate than in June. The hires rate fell to 3.2% from an upwardly revised 3.4% in June. [...]
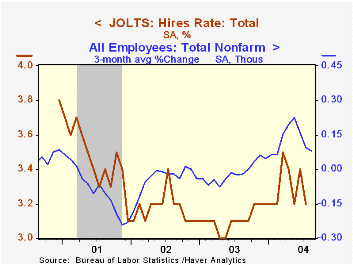
The Job Openings & Labor Turnover Survey (JOLTS) from the Bureau of Labor Statistics for July continued to indicate improved hiring, but at a slower rate than in June. The hires rate fell to 3.2% from an upwardly revised 3.4% in June. These figures are versus the monthly low of 3.0% last Spring and 3.1% during all of last year.
The hires rate in manufacturing slipped to 2.4% from 2.6% in June but remained above the 2.2% averaged last year.
The survey dates only to December 2000 but has since followed closely the movement in nonfarm payrolls.
The job openings rate rose to 2.4%, the highest level since October 2002.
Chairman Greenspan's testimony on the economic outlook is available here.
| JOLTS (Job Openings & Labor Turnover Survey) | July | June | July '03 | 2003 | 2002 | 2001 |
|---|---|---|---|---|---|---|
| Job Openings Rate: Total | 2.4% | 2.3% | 2.1% | 2.1% | 2.2% | 2.8% |
| Hires Rate: Total | 3.2% | 3.4% | 3.1% | 3.1% | 3.2% | 3.5% |
by Tom Moeller September 8, 2004
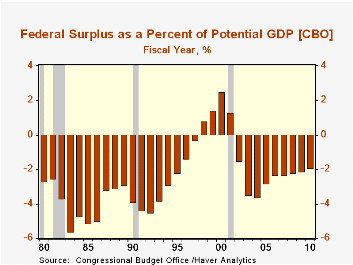
The Congressional Budget Office Updated its US budget outlook. The current deficit estimates of $422 for FY04 and $348B for FY05 are below the $477B and $363B estimated six months ago due to improved economic & technical assumptions.
The ten year deficit outlook, however, deteriorated due to raised spending estimates (mostly military & Medicare) which more than offset raised estimates of revenues.
"The Budget and Economic Outlook: An Update" from the Congressional Budget Office is available here.
For the first ten months of FY04 the deficit of $395.8 was 22.2% larger than last year. Budget deficits raised the growth in outstanding liabilities of the Federal government through 1Q04 to 12.7% versus 8.0% growth in nonfederal liabilities.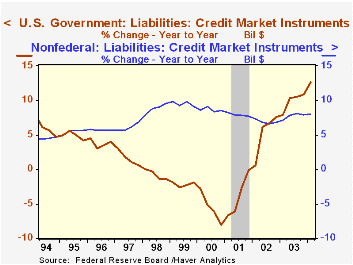
Growth in net receipts for the first ten months of FY04 improved to 4.0% versus a 3.9% decline during the first ten months of FY03. Individual tax receipts were down 0.3% versus a 6.9% decline in the first ten months of FY03. Corporate tax receipts for the fiscal year-to-date were up 45.0% ($145.3B) versus last fiscal YTD.
Growth in Federal net expenditures was about stable at 7.2% versus the first ten months of last fiscal year. Defense expenditures grew 14.8% versus 15.9% last year. Growth in Medicare outlays was 8.6% versus 8.3%. Interest expense grew 3.7% versus a 10.0% decline during last year's first ten months.
| US Government Finance | July | June | July '03 | FY2003 | FY2002 | FY2001 |
|---|---|---|---|---|---|---|
| Budget Balance | $-69.2B | $19.1B | $-54.2B | $-374.2B | $-157.8B | $127.3B |
| Revenues | $134.4B | $214.4B | 8.8% | -3.8% | -6.9% | -1.7% |
| Outlays | $203.6B | $195.2B | 14.5% | 7.2% | 7.9% | 4.2% |
by Tom Moeller September 8, 2004
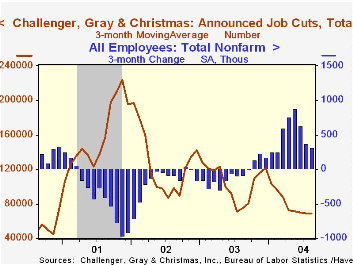
Challenger, Gray & Christmas reported that announced job cuts rose another 6.6% in August on top of an 8.1% rise the prior month. The increase to 74,150 was to the highest level since February.
The three month moving average of job cut announcements rose modestly to 69,355 (-7.4% y/y).
During the last ten years there has been an 86% (inverse) correlation between the three month moving average of announced job cuts and the three month change payroll employment.
Job cut announcements differ from layoffs. Many are achieved through attrition, early retirement or just never occur.
A new series from Challenger indicated that announced hiring plans in August surged to a multiple of intentions for July. The series dates back only to May.
| Challenger, Gray & Christmas | Aug | July | Y/Y | 2003 | 2002 | 2001 |
|---|---|---|---|---|---|---|
| Announced Job Cuts | 74,150 | 69,572 | -7.2% | 1,236,426 | 1,431,052 | 1,956,876 |
by Tom Moeller September 8, 2004
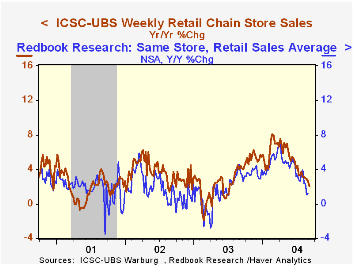
Chain store sales slipped ticked slightly higher last week but the level of sales was little changed from four weeks ago according to the International Council of Shopping Centers (ICSC)-UBS.
Sales began September 0.2% below the August average which was unchanged from July.
During the last ten years there has been a 60% correlation between y/y change in chain store sales and the change in non-auto retail sales less gasoline.
The ICSC-UBS retail chain-store sales index is constructed using the same-store sales reported by 78 stores of seven retailers: Dayton Hudson, Federated, Kmart, May, J.C. Penney, Sears and Wal-Mart.
| ICSC-UBS (SA, 1977=100) | 09/04/04 | 08/28/04 | Y/Y | 2003 | 2002 | 2001 |
|---|---|---|---|---|---|---|
| Total Weekly Retail Chain Store Sales | 438.6 | 438.4 | 2.1% | 2.9% | 3.6% | 2.1% |
by Tom Moeller September 8, 2004
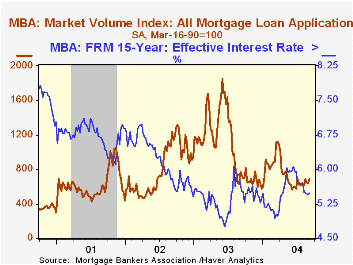
The effective interest rate on a conventional 30-year mortgage ticked up last week to 6.06% from 6.02% the prior week, but those rates were little changed from the 6.04% averaged in August. In May, 30-year financing averaged 6.53%. The effective rate on a 15-year mortgage was 5.49%.
The index of mortgage applications compiled by the Mortgage Bankers Association jumped 7.7% from the prior week as purchase applications surged 7.4% and began the month 6.1% above August which fell 2.8% from July.
During the last ten years there has been a 59% correlation between the y/y change in purchase applications and the change in new plus existing home sales.
Applications to refinance mortgages surged 8.0%following two weeks of decline. Refi's began September 7.5%% ahead of August.
The Mortgage Bankers Association surveys between 20 to 35 of the top lenders in the U.S. housing industry to derive its refinance, purchase and market indexes. The weekly survey accounts for more than 40% of all applications processed each week by mortgage lenders. Visit the Mortgage Bankers Association site here.
| MBA Mortgage Applications (3/16/90=100) | 09/03/04 | 08/27/04 | Y/Y | 2003 | 2002 | 2001 |
|---|---|---|---|---|---|---|
| Total Market Index | 692.0 | 642.7 | -10.3% | 1,067.9 | 799.7 | 625.6 |
| Purchase | 476.0 | 443.1 | 16.4% | 395.1 | 354.7 | 304.9 |
| Refinancing | 1,948.9 | 1,804.1 | -32.4% | 4,981.8 | 3,388.0 | 2,491.0 |
by Carol Stone September 8, 2004
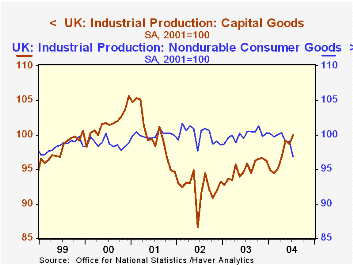
Yesterday, we described an improving trend in German industrial production through July, an encouraging sign for Europe as a whole. At the same time, not all countries are fully on board yet. Data reported yesterday for the UK show two months of hesitation and a report this morning from the Netherlands indicates that Dutch industry is still struggling to get on a sustained uptrend.
UK output fell 0.3% in July following a similar decline in June. Trends are mixed among UK sectors, as production of capital goods and of consumer durable goods increased, while that of intermediate products and energy has had a listless performance and consumer nondurables continue to slide. Obviously, the improving pattern in investment and consumer durables, the most cyclical products, is quite favorable in the midst of an otherwise clouded picture. Indeed, capital goods output is the highest since the summer of 2001.
In the Netherlands, manufacturing output has been uneven. It appeared to reach a bottom at the middle of last year and tilted up slightly in subsequent months. However, the declines in May and again in July erase most of those gains and leave factories just above their year-ago operating pace. Details will be published tomorrow. In the meantime, through June, food and textile production in the Netherlands were sources of weakness, as they have been in the UK. This suggests that consumer demand in those countries could still be sluggish and/or that import competition is pressuring domestic industry.
| Industrial Production, % Changes |
July 2004 | June 2004 | May 2004 | Year/ Year | 2003 | 2002 | 2001 |
|---|---|---|---|---|---|---|---|
| UK | -0.3 | -0.3 | 0.4 | -2.5 | -0.1 | -2.5 | -1.6 |
| Netherlands* | -0.6 | 0.1 | -0.7 | 0.2 | -2.8 | -0.8 | -0.1 |
| Germany | 1.6 | -1.5 | 1.0 | -1.1 | 0.1 | -1.3 | -0.8 |

Tom Moeller
AuthorMore in Author Profile »Prior to joining Haver Analytics in 2000, Mr. Moeller worked as the Economist at Chancellor Capital Management from 1985 to 1999. There, he developed comprehensive economic forecasts and interpreted economic data for equity and fixed income portfolio managers. Also at Chancellor, Mr. Moeller worked as an equity analyst and was responsible for researching and rating companies in the economically sensitive automobile and housing industries for investment in Chancellor’s equity portfolio. Prior to joining Chancellor, Mr. Moeller was an Economist at Citibank from 1979 to 1984. He also analyzed pricing behavior in the metals industry for the Council on Wage and Price Stability in Washington, D.C. In 1999, Mr. Moeller received the award for most accurate forecast from the Forecasters' Club of New York. From 1990 to 1992 he was President of the New York Association for Business Economists. Mr. Moeller earned an M.B.A. in Finance from Fordham University, where he graduated in 1987. He holds a Bachelor of Arts in Economics from George Washington University.
More Economy in Brief


