 Global| May 29 2003
Jobless Insurance Claims Fell
by:Tom Moeller
|in:Economy in Brief
Summary
Initial claims for unemployment insurance fell slightly less than expected last week. Claims fell 2.1% to 424,000 from an upwardly revised level the week prior. Consensus expectations were for claims of 420,000. It was the fourth [...]
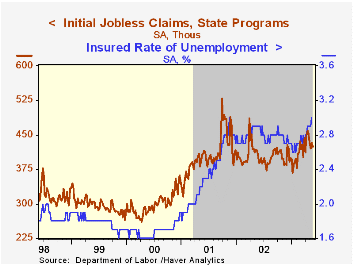
Initial claims for unemployment insurance fell slightly less than expected last week. Claims fell 2.1% to 424,000 from an upwardly revised level the week prior. Consensus expectations were for claims of 420,000.
It was the fourth decline in claims in the last five weeks. Initial claims have fallen 7.6% during that period.
The four-week moving average of initial claims fell to 427,000 (+3.1% y/y).
During the last ten years there has been a 67% (inverse) correlation between the level of initial jobless insurance claims and the m/m change in nonfarm payrolls to be released next Friday.
Continuing claims for unemployment insurance rose 2.3% w/w to a level just below the cycle high set in November 2001..
The insured rate of unemployment rose to 3.0%, equal to the cycle high.
| Unemployment Insurance (000s) | 5/24/03 | 5/17/03 | Y/Y | 2002 | 2001 | 2000 |
|---|---|---|---|---|---|---|
| Initial Claims | 424.0 | 433.0 | 3.7% | 404.3 | 406.0 | 299.7 |
| Continuing Claims | -- | 3,763 | 1.5% | 3,575 | 3,022 | 2,114 |
by Tom Moeller May 29, 2003
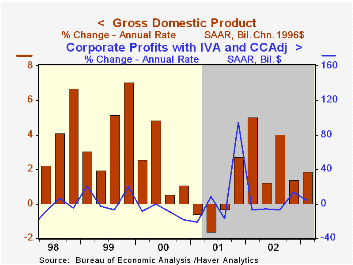
Real GDP grew 1.9% (AR). The upward revision to growth from 1.6% was right in line with Consensus expectations.
Domestic demand growth was revised up slightly to 1.4% due to an upward revision to personal consumption growth to 2.0% (2.4% y/y) from 1.4%.
Fixed business investment fell 4.8% (-1.5% y/y) versus an initial estimate of a 4.2% decline.
Residential investment surged at an 11.0% (5.9% y/y) rate, revised down from 12.0%.
A slowdown in inventory accumulation subtracted 0.5 percentage points from GDP growth and was unrevised.
Improvement in the trade deficit was unrevised and added to GDP growth for the first quarter in two years. Exports were revised up to a 1.4% rate of decline from -3.2% but imports also were revised to -7.1% from -7.9%.
Inflation was unrevised at 2.5% (AR).
Corporate profits w/adjustment for inventory valuation and depreciation rose at a 4.0% rate (0.8% y/y) following a 13.7% rise in 4Q02. The tax liability on profits soared 24.9%. Therefore after tax operating profits fell at a 3.3% rate. Before tax profits without IVA & CCA rose 14.9% (12.5% y/y) and rose 10.5% after tax.
| Chained '96 $, % AR | 1Q'03 (Prelim) | 1Q'03 (Advance) | 4Q'02 | Y/Y | 2002 | 2001 | 2000 |
|---|---|---|---|---|---|---|---|
| GDP | 1.9% | 1.6% | 1.4% | 2.1% | 2.4% | 0.3% | 3.8% |
| Inventory Effect | -0.5% | -0.5% | 0.3% | 0.5% | 0.6% | -1.2% | 0.1% |
| Final Sales | 2.4% | 2.1% | 1.1% | 1.7% | 1.8% | 1.5% | 3.7% |
| Trade Effect | 0.9% | 0.9% | -1.6% | -0.5% | -0.5% | -0.1% | -0.6% |
| Domestic Final Demand | 1.4% | 1.2% | 2.6% | 2.1% | 2.4% | 1.6% | 4.3% |
| Chained GDP Price Deflator | 2.5% | 2.5% | 1.8% | 1.6% | 1.1% | 2.4% | 2.1% |
by Tom Moeller May 29, 2003
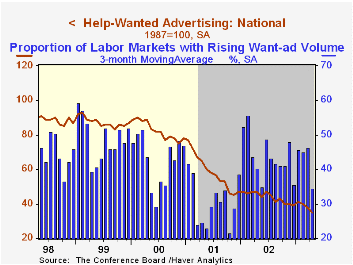
The Conference Board's National Index of Help-Wanted Advertising continued its downtrend last month, falling to the lowest level since 1961.
The proportion of labor markets with rising want-ad volume collapsed to 20% versus a downwardly revised level of 43% in March. That pulled the three month moving average of this indicator to the lowest level since last May.
During the last ten years there has been a 69% correlation between the level of help-wanted advertising and the monthly change in nonfarm payrolls. The correlation with the y/y change in employment has been 92%.
All of the figures mentioned above are seasonally adjusted.
The Conference Board surveys help-wanted advertising volume in 51 major newspapers across the country every month.
Visit the Conference Board for more information.
| Conference Board | April | Mar | April '02 |
|---|---|---|---|
| National Help Wanted Index | 35 | 38 | 47 |
by Tom Moeller May 29, 2003
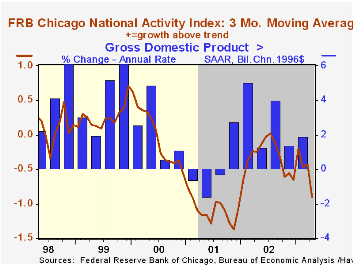
The Chicago Fed National Activity Index (CFNAI) fell in April to -0.85, the second lowest level since November 2001. . A zero value of the CFNAI indicates that the economy is expanding at its historical trend rate of growth of just over 3% p.a.
The three-month moving average of the CFNAI was -0.90, also its lowest level since late 2001 and consistent with negligible real GDP growth.
During the last ten years there has been a 73% correlation between the level of the CFNAI and quarterly growth in real GDP.
The CFNAI is a weighted average of 85 indicators of economic activity. The indicators reflect activity in the following categories: production & income, the labor market, personal consumption & housing, mfg. & trade sales, and inventories & orders.
For a complete discussion of the latest Chicago Fed's National Activity Index click here.
A discussion of the CFNAI and its role as a business cycle indicator can be found here.
| Chicago Fed | April | Mar | April '02 | 2002 | 2001 | 2000 |
|---|---|---|---|---|---|---|
| CFNAI | -0.85 | -0.69 | 0.00 | -0.30 | -1.13 | -0.13 |

Tom Moeller
AuthorMore in Author Profile »Prior to joining Haver Analytics in 2000, Mr. Moeller worked as the Economist at Chancellor Capital Management from 1985 to 1999. There, he developed comprehensive economic forecasts and interpreted economic data for equity and fixed income portfolio managers. Also at Chancellor, Mr. Moeller worked as an equity analyst and was responsible for researching and rating companies in the economically sensitive automobile and housing industries for investment in Chancellor’s equity portfolio. Prior to joining Chancellor, Mr. Moeller was an Economist at Citibank from 1979 to 1984. He also analyzed pricing behavior in the metals industry for the Council on Wage and Price Stability in Washington, D.C. In 1999, Mr. Moeller received the award for most accurate forecast from the Forecasters' Club of New York. From 1990 to 1992 he was President of the New York Association for Business Economists. Mr. Moeller earned an M.B.A. in Finance from Fordham University, where he graduated in 1987. He holds a Bachelor of Arts in Economics from George Washington University.
More Economy in Brief


