 Global| Feb 04 2005
Japan's Leading Indicators Hesitate, but Strength Remains in Employment, Stock Market Components
Summary
Japan's leading indicators declined in December, falling 1.1% to 101.8 (1000=100) and ending the year 0.6% below the year's average. Six of the 10 available components dragged down the month's results, among them new home [...]
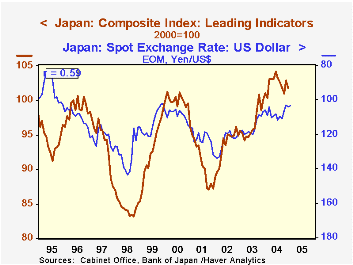
Japan's leading indicators declined in December, falling 1.1% to 101.8 (1000=100) and ending the year 0.6% below the year's average. Six of the 10 available components dragged down the month's results, among them new home construction, consumer confidence and the yield curve. Four indicators had positive contributions, including low inventories of finished goods, new job offers, stock prices and small businesses' sales forecast. Of these, only job offers has been up in previous recent months; others turned up from negative readings in November. Several of the negative components, though, do have longer strings of negative moves, including the yield curve, for four months and home construction for three.
Thus, the picture in these leading indicators is mixed, and this is the fourth straight month in which fewer than half of the items have been positive. Nonetheless, it seems premature to alter one's view of the Japanese outlook. Such a hesitation in the leaders has occurred before, most recently in 1995, without endangering the general pattern of business growth.
The current uptrend in the coincident indicators started at the beginning of 2002. This, interestingly, coincides with the upturn in the yen against the dollar. Conventional wisdom suggests that the strengthening yen should hurt the economy, but this hasn't had such an impact yet. Notably, in fact, the correlation of the leading indicators with the foreign exchange value of the yen is positive, albeit somewhat erratic over differing spans. Perhaps then, the higher yen is a reflection of the improved condition of the Japanese economy. Recent gains in the stock market and employment indicators, also including the coincident indicator "effective job offer rate", may help maintain upward momentum in that important economy.
| Dec 2004 |
Nov 2004 | Oct 2004 |
Dec 2003 | 2004 | 2003 | 2002 | |
|---|---|---|---|---|---|---|---|
| Leading Indicator Index, 2000=100 | 101.8 | 102.9 | 101.0 | 100.0 | 102.4 | 96.6 | 93.3 |
| Yr/Yr % Chg | 1.8 | 4.5 | 0.1 | 5.4 | 6.0 | 3.6 | 2.3 |
| Exchange Rate: Yen/Dollar | 104.12 | 103.18 | 106.13 | 107.10 | 107.79 | 115.70 | 124.65 |
| Yr/Yr % Chg | -2.8 | -5.8 | -2.4 | -10.7 | -6.8 | -7.2 | 2.1 |
Carol Stone, CBE
AuthorMore in Author Profile »Carol Stone, CBE came to Haver Analytics in 2003 following more than 35 years as a financial market economist at major Wall Street financial institutions, most especially Merrill Lynch and Nomura Securities. She had broad experience in analysis and forecasting of flow-of-funds accounts, the federal budget and Federal Reserve operations. At Nomura Securities, among other duties, she developed various indicator forecasting tools and edited a daily global publication produced in London and New York for readers in Tokyo. At Haver Analytics, Carol was a member of the Research Department, aiding database managers with research and documentation efforts, as well as posting commentary on select economic reports. In addition, she conducted Ways-of-the-World, a blog on economic issues for an Episcopal-Church-affiliated website, The Geranium Farm. During her career, Carol served as an officer of the Money Marketeers and the Downtown Economists Club. She had a PhD from NYU's Stern School of Business. She lived in Brooklyn, New York, and had a weekend home on Long Island.
More Economy in Brief


