 Global| Feb 25 2009
January U.S. Existing Home Sales & Prices Fell
by:Tom Moeller
|in:Economy in Brief
Summary
Any prior indication that home sales were stabilizing should be dismissed. According to the National Association of Realtors, sales of existing homes fell 5.3% last month to 4.490M after an unrevised December rise of 4.4%. Consensus [...]
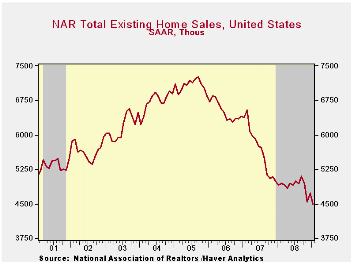
Any prior indication that home sales were stabilizing should be dismissed. According to the National Association of Realtors, sales of existing homes fell 5.3% last month to 4.490M after an unrevised December rise of 4.4%. Consensus expectations had been for January sales of 4.79M homes. Total sales include sales of condos and co-ops.
For existing single-family homes alone sales reversed all of their December rise with a 4.7% decline to 4,050 million units, the lowest level since July 1997. (These data have a longer history than the total series).
The weakness in sales continued to lower pricing power. Median home prices plumbed a new cycle low with a 3.1% month-to-month (NSA) decline. It was the seventh consecutive monthly drop and it lowered prices by 14.8% from January of 2008. Prices have fallen 25.8% since their peak in June 2005.
The number of unsold homes (condos & single-family) on
the market dropped 2.7% (-13.5% y/y) as sellers pulled homes for sale.
At the current sales rate there was a 9.6 months' supply on the market
which was near the lowest since 2007. For single-family homes the
inventory was unchanged after a sharp December decline and at the
current sales rate there was a 9.2 month's supply, near the lowest
since 2007.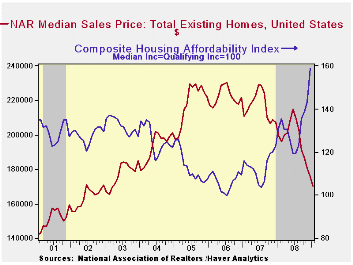
By region, home sales in the Northeast collapsed 14.7% m/m to lower them by nearly one quarter from the year ago level. Single family home sales here were at their lowest since 1991, off 46% from the 2007 peak. Sales in the South followed with a 5.7% decline which reversed the December gain. Single family sales were at their lowest since early 1998. Sales in the Midwest also reversed the December gain with a 5.7% decline to the lowest level since 1997. Only sales in the West held up. They were unchanged last month from December and they were up by 29% from the year ago level.
Declines in home prices and lower interest rates have gone a long way to increase the affordability of an existing home. The measure rose to a record high for the series which dates back to 1971.
The data on existing home sales, prices and affordability can be found in Haver's USECON database. The regional price, affordability and inventory data is available in the REALTOR database.
Commitment Versus Discretion in Monetary Policy from the Federal Reserve Bank of Philadelphia is available here.
| Existing Home Sales (Thous) | January | y/y % | December | January '08 | 2008 | 2007 | 2006 |
|---|---|---|---|---|---|---|---|
| Total | 4,490 | -8.6 | 4,740 | 4,910 | 4,893 | 5,674 | 6,516 |
| Northeast | 640 | -23.8 | 750 | 840 | 845 | 1,010 | 1,093 |
| Midwest | 1,000 | -16.7 | 1,060 | 1,200 | 1,130 | 1,331 | 1,494 |
| South | 1,640 | -15.9 | 1,740 | 1,950 | 1,860 | 2,243 | 2,577 |
| West | 1,200 | 29.0 | 1,200 | 930 | 1,064 | 1,095 | 1,357 |
| Single-Family | 4,050 | -7.1 | 4,250 | 4,360 | 4,341 | 4,960 | 5,712 |
| Median Price, Total, $ | 170,300 | -14.8 | 175,700 | 199,800 | 197,250 | 216,633 | 222,042++ |
U.S. Mortgage Applications Fall: Refi's & Purchase Applications Off
by Tom Moeller February 25, 2009

The Mortgage Bankers Association indicated that the total number of mortgage applications fell 15.1% from the prior week and that they were off roughly 40% from the peaks earlier this year. Applications had been boosted by lower interest rates which touched the lows of 2003. Few borrowers took out an adjustable rate loan last week (-85.6% y/y) while low interest rates encouraged fixed rate financing; it's more than double the volume at the end of last year.
The index of applications to refinance a home mortgage fell by 19.1% last week after a 64.3% spike during the prior period. While these applications are down by half from their earlier high, the trend still is up due to the decline in interest rates.
Applications for a mortgage to purchase a home also fell last
week. The 2.6% decline reversed only some of the prior week's 9.1% rise
but the trend remained sharply downward with the fallout in home sales.
Since their peak early last year these applications are down nearly 50%.
The effective interest rate on a conventional 15-year mortgage fell week-to-week to 4.99%. That was near the lowest level since 2003, after which home sales surged. For a 30-year mortgage rates held near their recent lows at 5.32%. Interest rates on 15 and 30 year mortgages are closely correlated (>90%) with the rate on 10-year Treasury securities. For an adjustable 1-Year mortgage the rate also held near its recent low at 6.18%, down nearly a full percentage point from this past Fall.
During the last ten years there has been a (negative) 79% correlation between the level of applications for purchase and the effective interest rate on a 30-year mortgage. Moreover, during the last ten years there has been a 61% correlation between the y/y change in purchase applications and the change in new plus existing single family home sales.
The figures for weekly mortgage applications are available in Haver's SURVEYW database.
The Mortgage Bankers Association surveys between 20 to 35 of the top lenders in the U.S. housing industry to derive its refinance, purchase and market indexes. The weekly survey covers roughly 50% of all U.S. residential mortgage applications processed each week by mortgage banks, commercial banks and thrifts. Visit the Mortgage Bankers Association site here.
Tax Credits for Job Creation and Retention: What Can We Learn from the States? from the Federal Reserve Bank of San Francisco can be found here.
| MBA Mortgage Applications (3/16/90=100) | 02/20/09 | 02/13/09 | Y/Y | 2008 | 2007 | 2006 |
|---|---|---|---|---|---|---|
| Total Market Index | 743.5 | 875.3 | 11.8% | 642.9 | 652.6 | 584.2 |
| Purchase | 250.5 | 257.3 | -30.1% | 345.4 | 424.9 | 406.9 |
| Refinancing | 3,618.0 | 4,472.9 | 47.1% | 2,394.1 | 1,997.9 | 1,634.0 |
Yen-Based Japan Exports Are CutNearly In Half
by Robert Brusca February 25, 2009
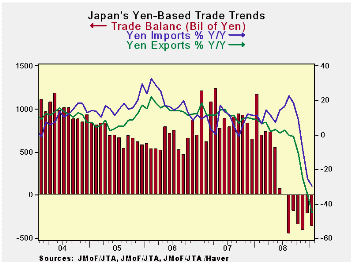
In a stunning blow to a reeling economy Japan reports that its
exports are lower in January compared to one year ago by 45% - nearly
halving of the flow. There are several components to this drop. One is
the yen that has risen; that will translate foreign currency-based
Japan exports into a smaller value in terms of yen. The yen rose to
90.12/$ in January compared to its level of 101.91/$ a year ago, a yen
rise of 16%. Another aspect of the drop in value is that yen-based
export prices have fallen Year over year. Japan export prices fell by
13.5% Year over year. These two factors make up a good deal of the 45%
drop in the yen value of Japan’s exports. But not all of Japan’s
exports are in dollar terms. Japan’s largest trade partner in fact is
China; its second largest partner is the US. Moreover, the drop in the
current value of yen trade flows is not simply an ‘index number’
problem. It does reflect real stress that flows back to Japan when
export dollar sales buy fewer yen, especially if Japan’s costs are
expressed in yen- as most surely are despite outsourcing.
Japan’s imports are down by nearly 30% Year-over-year, another
significant number. The rise in the yen plays a role there by first
taking a fixed import bill expressed in foreign currency and making it
smaller when translated into a stronger yen, just as for exports. But
eventually the stronger yen and weaker FX value of competing currencies
should lead to an increase in Japan’s import volumes and cause yen
VALUE flows to rise or at least to mitigate their drop (depending on
the size of the import price elasticities). Let’s look at this concept
of ‘elasticity:’ If Japan import price elasticities are less than
‘minus one’ Japan’s import values will eventually rise further as Japan
buys more of the cheaper import and that offsets the fact that each
import is worth fewer yen by increasing the volume of its purchases.
That is what the concept of elasticity measures. A price elasticity of
less than ‘minus one’ means that a one percent drop in yen prices (say
forced by a yen appreciation) will lead to more than a one percent
increase in the volume of goods imported. Yen import prices are falling
already (mostly lower oil prices). But the progression of events that
lead to a boost in import volumes takes time. Plus don’t hold your
breath waiting for this impact since Japan’s own recession is
contracting imports, a factor that will swamp and elasticity effect
from prices. For the moment, yen-based import prices are down by nearly
25% Yr/Yr accentuating any VOLUME drop in Japan’s imports on observed
import VALUE. Of course, to the extent that Japan invoices its imports
in yen the result of the yen’s rise would me blunted, since a yen
import is a yen import regardless of the dollar, euro or yuan exchange
rate.
On balance these trade flows for Japan paint a very distressed
picture of Japan’s economy. Japan has joined Germany and others in
being a voice in favor of maintaining ‘free trade.’ Just today the WTO
has issued another call for nations to uphold their free trade
agreements. The ‘buy America’ clause in the US stimulus bill is one
development that is cited again and again in these sorts of
communiqués. The US insists that its provision is fully consistent with
its free trade agreements.
We can see that with the world economy shutting down, like
some out of control Windows command that is turning off your computer
while you are trying to work, that chaos is being spread. Export
dependent nations are being crushed by the global economies since
manufactured goods exports have high relatively high income
elasticities. That means when times are good and global incomes are
growing exports shoot ahead strongly but it also means that export
volumes contract sharply in a downturn. Japan is being battered in part
by the impact of US auto sales dropping from over 15mu to just about
10mu. There is nothing anticompetitive about that: it’s just recession.
That is a drop of 33% and it will cause the Yr/Yr drop in yen exports
to be registered at about 46% if Japan holds its share in this
contracting market. Of course cutting back on shipments to the US to
trim inventories plus taking lower prices into account could further
exaggerate the flow’s ultimate decline. In the event, Japan’s exports
of autos in yen terms to the world have fallen by 66% since January of
one year ago.
| Japan Trade Trends | |||||||
|---|---|---|---|---|---|---|---|
| in period level of % ch | Average in period/or % change | ||||||
| All data yen basis | Jan-09 | Dec-08 | Nov-08 | 3Mprev | 6Mprv | 12-Mprv | 12 mo Ago |
| Balance on Goods | #N/A | (1,341) | (3,343) | (1,167) | (70) | 3,271 | 10,356 |
| % m/m | % saar | ||||||
| X Goods % | -10.4% | -11.6% | -13.4% | -83.5% | -63.5% | -44.9% | 8.8% |
| Motor Vehicles | -39.0% | -18.1% | -20.6% | -98.2% | -89.1% | -66.1% | 12.7% |
| M Goods %, | -6.9% | -14.2% | -11.7% | -79.5% | -57.1% | -29.6% | 11.3% |
| Motor Vehicles | -24.4% | 7.4% | 6.2% | -74.1% | -61.1% | -31.5% | 4.3% |
| Prices In %, saar | 3M | 6M | 12-M | 12 mo Ago | |||
| PX | 0.1% | -4.4% | -3.7% | -46.8% | -29.0% | -13.5% | -5.7% |
| PM | -4.2% | -11.4% | -10.3% | -77.8% | -57.0% | -24.6% | 7.4% |
| Memo: Yen/$, AVG, Level | 90.12 | 91.28 | 96.97 | 92.79 | 99.05 | 101.91 | 116.72 |
| Memo Yen Percent ('-' is a fall) | 1.3% | 5.9% | 3.0% | 48.9% | 28.9% | 16.4% | 10.5% |

Tom Moeller
AuthorMore in Author Profile »Prior to joining Haver Analytics in 2000, Mr. Moeller worked as the Economist at Chancellor Capital Management from 1985 to 1999. There, he developed comprehensive economic forecasts and interpreted economic data for equity and fixed income portfolio managers. Also at Chancellor, Mr. Moeller worked as an equity analyst and was responsible for researching and rating companies in the economically sensitive automobile and housing industries for investment in Chancellor’s equity portfolio. Prior to joining Chancellor, Mr. Moeller was an Economist at Citibank from 1979 to 1984. He also analyzed pricing behavior in the metals industry for the Council on Wage and Price Stability in Washington, D.C. In 1999, Mr. Moeller received the award for most accurate forecast from the Forecasters' Club of New York. From 1990 to 1992 he was President of the New York Association for Business Economists. Mr. Moeller earned an M.B.A. in Finance from Fordham University, where he graduated in 1987. He holds a Bachelor of Arts in Economics from George Washington University.
More Economy in Brief


