 Global| Nov 05 2003
ISM Nonmanufacturing Index Jumped
by:Tom Moeller
|in:Economy in Brief
Summary
The Institute for Supply Management reported that the October Business Activity Index for the non-manufacturing sector gained back most of the prior month's decline. The increase to 64.7 was versus Consensus expectations for little [...]
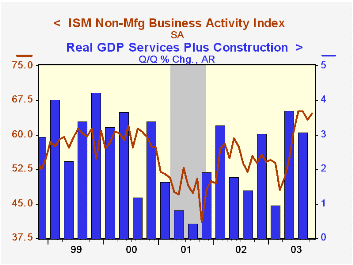
The Institute for Supply Management reported that the October Business Activity Index for the non-manufacturing sector gained back most of the prior month's decline. The increase to 64.7 was versus Consensus expectations for little change at 63.5.
Since the series' inception in 1997 there has been a 58% correlation between the level of the ISM non-manufacturing business activity index and the quarterly change in real GDP for services plus construction.
The employment index was quite strong, rising 3.8 points to 52.9, the highest level since November 2000.
Since the series' inception in 1997 there has been an 68% correlation between the level of the ISM non-manufacturing employment index and the m/m change in payroll employment in the service producing and construction industries.
The seasonally adjusted orders index posted a rise to 64.4 and gained back more than half of the sharp September drop.Business activity for the non-manufacturing sector is a question separate from the subgroups mentioned above. In contrast, the NAPM manufacturing sector composite index weights the components.
The seasonally adjusted prices index fell moderately to 58.7.
ISM surveys more than 370 purchasing managers in more than 62 industries including construction, law firms, hospitals, government and retailers. The non-manufacturing survey dates only to July 1997, therefore its seasonal adjustment should be viewed tentatively.
| ISM Nonmanufacturing Survey | Oct | Sept | Y/Y | 2002 | 2001 | 2000 |
|---|---|---|---|---|---|---|
| Business Activity Index | 64.7 | 63.3 | 53.9 | 55.1 | 49.0 | 59.3 |
| Prices Index | 58.7 | 60.1 | 56.5 | 53.9 | 51.6 | 63.5 |
by Tom Moeller November 5, 2003
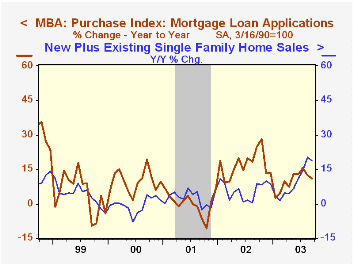
The index of mortgage applications compiled by the Mortgage Bankers Association rose 5.5% (-33.5% y/y) last week on the strength of higher purchase applications.
Purchase applications jumped 11.1% following a 5.7% drop the week prior. Purchase applications for all of October fell 4.7% (+12.1% y/y) versus September.
During the last ten years there has been a 54% correlation between the y/y change in purchase applications and the change in new plus existing home sales.
Applications to refinance ticked up 0.3% following a 4.9% rise week prior. For all of October applications to refinance fell 5.0% (-58.6% y/y) versus September.
The effective interest rate on a conventional 30-Year mortgage rose slightly w/w to 6.14%. The effective rate on a 15-year mortgage also rose w/w to 5.52%.
The Mortgage Bankers Association surveys between 20 to 35 of the top lenders in the U.S. housing industry to derive its refinance, purchase and market indexes. The weekly survey accounts for more than 40% of all applications processed each week by mortgage lenders. Visit the Mortgage Bankers Association site here.
| MBA Mortgage Applications (3/16/90=100) | 10/31/03 | 10/24/03 | 2002 | 2001 | 2000 |
|---|---|---|---|---|---|
| Total Market Index | 685.2 | 649.6 | 799.7 | 625.6 | 322.7 |
| Purchase | 404.3 | 363.9 | 354.7 | 304.9 | 302.7 |
| Refinancing | 2,319.4 | 2,311.8 | 3,388.0 | 2,491.0 | 438.8 |
by Tom Moeller November 5, 2003
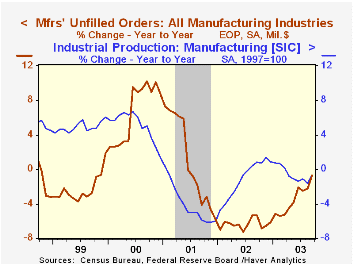
Manufacturing inventories fell 0.4% in September for the sixth monthly decline this year. The ISM inventory index in October ticked a bit higher vs. September but at 44.5 suggested further decumulation last month. Declines in inventories continued widespread.
New research from the Federal Reserve Bank of Philadelphia titled "The Role of Inventories in the Business Cycle" can be found here.
Factory orders rose about as expected, up 0.5% in September. The ISM orders index surged to 64.3 in October. During the last ten years there has been a 38% correlation between the y/y change in factory orders and the level of the ISM orders index.
Durable goods orders were revised upward to a 1.1% m/m increase versus the 0.8% rise indicated in last week's advance report.
Non-durable goods orders fell 0.2% m/m (+4.2% y/y) following a 0.6% decline in August. The y/y strength in non-durable goods orders derives mostly from higher prices for petroleum products and for industrial chemicals. (Non-durable goods orders equal shipments in this report on factory sector activity.)
Factory shipments jumped 1.4%. Shipments of transportation equipment were quite strong, up 6.2% (0.8% y/y) and mostly reflected higher shipments of autos & trucks. Excluding transportation, shipments rose 0.5% (3.5% y/y).
| Factory Survey (NAICS) | Sept | Aug | Y/Y | 2002 | 2001 | 2000 |
|---|---|---|---|---|---|---|
| Inventories | -0.4% | -0.3% | -1.3% | -1.8% | -6.1% | 3.8% |
| New Orders | 0.5% | -0.3% | 5.4% | -1.9% | -6.7% | 5.0% |
| Shipments | 1.4% | -1.7% | 3.1% | -2.0% | -5.4% | 4.2% |
| Unfilled Orders | 0.1% | 0.8% | -0.7% | -6.1% | -5.9% | 8.7% |

Tom Moeller
AuthorMore in Author Profile »Prior to joining Haver Analytics in 2000, Mr. Moeller worked as the Economist at Chancellor Capital Management from 1985 to 1999. There, he developed comprehensive economic forecasts and interpreted economic data for equity and fixed income portfolio managers. Also at Chancellor, Mr. Moeller worked as an equity analyst and was responsible for researching and rating companies in the economically sensitive automobile and housing industries for investment in Chancellor’s equity portfolio. Prior to joining Chancellor, Mr. Moeller was an Economist at Citibank from 1979 to 1984. He also analyzed pricing behavior in the metals industry for the Council on Wage and Price Stability in Washington, D.C. In 1999, Mr. Moeller received the award for most accurate forecast from the Forecasters' Club of New York. From 1990 to 1992 he was President of the New York Association for Business Economists. Mr. Moeller earned an M.B.A. in Finance from Fordham University, where he graduated in 1987. He holds a Bachelor of Arts in Economics from George Washington University.