 Global| Feb 01 2006
ISM Index Eased
by:Tom Moeller
|in:Economy in Brief
Summary
For January, the Institute of Supply Management (ISM) reported that the Composite Index of activity in the manufacturing sector eased to 54.8 from an upwardly revised level of 55.6 in December. It was the third consecutive monthly [...]
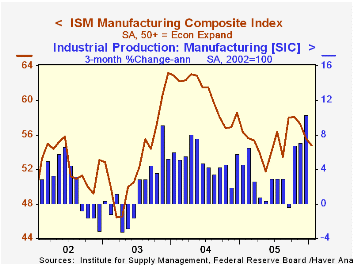
For January, the Institute of Supply Management (ISM) reported that the Composite Index of activity in the manufacturing sector eased to 54.8 from an upwardly revised level of 55.6 in December. It was the third consecutive monthly decline and left the index down sharply from the monthly peaks during 2003 & 2004 near 63. Consensus expectations for 55.4.
During the last twenty years there has been a 68% correlation between the level of the Composite Index and the three month growth in factory sector industrial production.
Four of the index's five components fell last month led by a 2.3 point drop in employment to the lowest level since June. During the last twenty years there has been a 67% correlation between the level of the ISM employment Index and the three month growth in factory sector employment.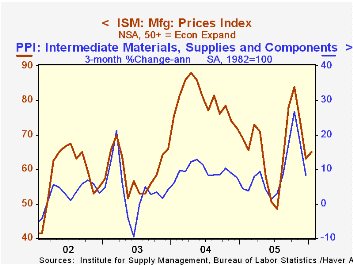
The new orders index fell 1.1 points and, at 58.0, is well below December 2003 peak of 71.6. Production fell 1.2 points to 56.6 and the inventory index slipped 0.8 points to 46.5, down sharply from the peak last March of 53.7. Only the supplier deliveries index rose in January to 55.3 but it remained down sharply from October's level of 60.8.
Prices continued to rise. A two point increase in the index to 65.0 nevertheless left the figure down from the recent peak of 84.0 in October. During the last twenty years there has been a 77% correlation between the price index and the three month change in the PPI for intermediate goods.
| ISM Manufacturing Survey | Jan | Dec | Jan '05 | 2005 | 2004 | 2003 |
|---|---|---|---|---|---|---|
| Composite Index | 54.8 | 55.6 | 56.3 | 55.5 | 60.5 | 53.3 |
| New Orders Index | 58.0 | 59.1 | 57.3 | 57.4 | 63.5 | 57.9 |
| Prices Paid Index (NSA) | 65.0 | 63.0 | 69.0 | 66.4 | 79.8 | 59.6 |
by Tom Moeller February 1, 2006
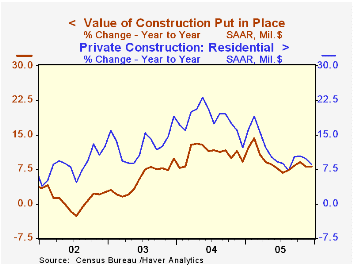
The value of construction put in place increased a firm 1.0% in December, double the upwardly revised November rise. Consensus expectations had been for a 0.2% gain.
Residential building rose a sharp 1.0% following little change in November. The value of improvements (-7.7% y/y) recovered most of the prior month's decline with a 3.2% increase and new multi-family residential (19.9% y/y) rose a strong 1.0%. New single family building added 0.2% (14.2% y/y) to several months of strong increase.
Nonresidential building rose strongly for the second consecutive month led by a 2.5% gain in office construction (13.9% y/y), a 2.6% rise in commercial (12.7% y/y) and a 1.9% increase in lodging (-0.5% y/y).
Public construction spending rose 0.7% following a revised 1.2% increase during November as construction activity on highways & streets, nearly one third of the value of public construction spending, dipped slightly m/m (9.1% y/y).
These more detailed categories represent the Census Bureau’s reclassification of construction activity into end-use groups. Finer detail is available for many of the categories; for instance, commercial construction is shown for Automotive sales and parking facilities, drugstores, building supply stores, and both commercial warehouses and mini-storage facilities. Note that start dates vary for some seasonally adjusted line items in 2000 and 2002 and that constant-dollar data are no longer computed.
| Construction Put-in-place | Dec | Nov | Y/Y | 2005 | 2004 | 2003 |
|---|---|---|---|---|---|---|
| Total | 1.0% | 0.5% | 8.1% | 9.1% | 10.9% | 5.4% |
| Private | 1.1% | 0.3% | 7.7% | 9.5% | 13.6% | 6.3% |
| Residential | 1.0% | 0.0% | 8.6% | 11.4% | 18.2% | 12.9% |
| Nonresidential | 1.3% | 1.1% | 5.5% | 5.2% | 3.9% | -5.4% |
| Public | 0.7% | 1.2% | 9.7% | 7.7% | 2.5% | 2.7% |
by Tom Moeller February 1, 2006
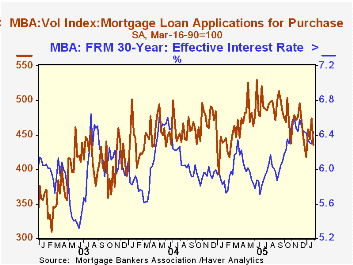
During the last week of January, the total number of mortgage applications reversed most of the prior week's increase with a 5.1% decline. Nevertheless, because of increases during the first three weeks of the month, mortgage applications still rose 5.2% on average in January versus December.
A 8.0% w/w decline in purchase applications was to the lowest level in four weeks and lowered the average level in January 0.6% below December.
During the last ten years there has been a 50% correlation between the y/y change in purchase applications and the change in new plus existing single family home sales
In contrast, applications to refinance were relatively firm as a 1.5% decline last week only dented the fairly strong increases of the prior four periods. As a result the average level of refis in January rose 17.7% versus December.
The effective interest rate on a conventional 30-year mortgage rose 15 basis points w/w to 6.44% versus an average 6.48% in December and a high November average of 6.52%. The effective rate on a 15-year mortgage rose about the same amount to 6.09%. The interest rates on 15 and 30 year mortgages are closely correlated (>90%) with the rate on 10 year Treasury securities.
The Mortgage Bankers Association surveys between 20 to 35 of the top lenders in the U.S. housing industry to derive its refinance, purchase and market indexes. The weekly survey accounts for more than 40% of all applications processed each week by mortgage lenders. Visit the Mortgage Bankers Association site here.
| MBA Mortgage Applications (3/16/90=100) | 01/27/06 | 01/20/06 | Y/Y | 2005 | 2004 | 2003 |
|---|---|---|---|---|---|---|
| Total Market Index | 626.8 | 660.5 | -11.3% | 708.6 | 735.1 | 1,067.9 |
| Purchase | 435.7 | 473.7 | -1.0% | 470.9 | 454.5 | 395.1 |
| Refinancing | 1,747.2 | 1,773.9 | -22.5% | 2,092.3 | 2,366.8 | 4,981.8 |
by Carol Stone February 1, 2006
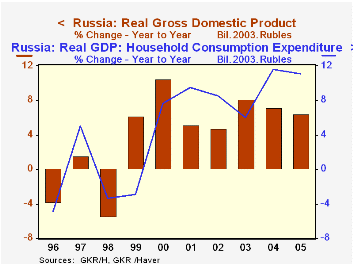
The State Committee of the Russian Federation reported GDP data today for the year 2005. Total GDP expanded 6.4% for the year as a whole. Assuming there are no meaningful revisions to the first three quarters of the year, the year-to-year growth for Q4 would be 7.0%, the same as for Q3, not seasonally adjusted. [The implied Q4 information is calculated by us, using DLX capabilities in Excel.]
For the year as a whole, growth slowed from 2004 in all major expenditure categories. For most, this downshift was quite modest. Indeed, private consumption remained on a firm growth path after picking up in 2004. In contrast, both exports and imports saw a sizable adjustment. Imports of goods and services had expanded 22.5% in 2004 and moderated to 16.2% in 2005. Exports had been up 11.9% in '04 and then grew only 5.6% last year. A cursory examination of the price deflator for exports suggests that accelerating prices, perhaps for oil, lifted nominal export growth, while export volume gains were much smaller, their weakest since 2001.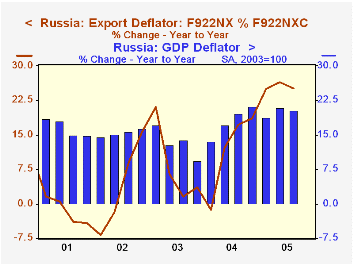
Prices in general seem still to be an issue in Russia. Inflation, again perhaps energy related, accelerated sharply in 2004, to nearly 20% from 13.2% in 2003. Last year saw a bit of moderation at a still-high rate. The acceleration is reflected in a price deflator for Russian exports, seen in the second graph. Deflators for consumption and capital formation don't show this significant increase, although they still run at 10-12% rates. Compared with its neighbors, this range of inflation is fairly high. The Ukraine and Kazakhstan experience occasional bouts of double-digit price increases, but most other surrounding industrial countries have much lower rates: Poland, Hungary, the Czech Republic, and so on. Russia continues then to grapple with structural difficulties that, despite its apparently healthy real growth, keep its overall economic performance in a rather precarious state.
| Russia (Bil.2003 Rubles) |
2005 Annual Level | % of Total | Q4 Y/Y Implied Growth | 2005 | 2004 | 2003 | 2005 |
|---|---|---|---|---|---|---|---|
| Total GDP | 15,101 | 100.0 | 7.0 | 6.4 | 7.2 | 8.2 | 4.7 |
| Private Consumption | 8,109 | 53.7 | -- | 11.1 | 11.6 | 6.0 | 8.5 |
| Gov't Consumption | 2,423 | 16.0 | -- | 1.8 | 2.1 | 0.6 | 2.6 |
| Capital Formation | 2,991 | 19.8 | -- | 10.5 | 11.3 | 11.5 | 2.8 |
| Imports | 4,488 | 29.7 | -- | 16.2 | 22.5 | 18.6 | 14.6 |
| Exports | 5,501 | 36.4 | -- | 5.6 | 11.9 | 12.4 | 10.3 |
| Deflator (2003=100) | 143.47 | -- | 25.7 | 19.7 | 19.9 | 13.2 | 15.5 |
Tom Moeller
AuthorMore in Author Profile »Prior to joining Haver Analytics in 2000, Mr. Moeller worked as the Economist at Chancellor Capital Management from 1985 to 1999. There, he developed comprehensive economic forecasts and interpreted economic data for equity and fixed income portfolio managers. Also at Chancellor, Mr. Moeller worked as an equity analyst and was responsible for researching and rating companies in the economically sensitive automobile and housing industries for investment in Chancellor’s equity portfolio. Prior to joining Chancellor, Mr. Moeller was an Economist at Citibank from 1979 to 1984. He also analyzed pricing behavior in the metals industry for the Council on Wage and Price Stability in Washington, D.C. In 1999, Mr. Moeller received the award for most accurate forecast from the Forecasters' Club of New York. From 1990 to 1992 he was President of the New York Association for Business Economists. Mr. Moeller earned an M.B.A. in Finance from Fordham University, where he graduated in 1987. He holds a Bachelor of Arts in Economics from George Washington University.
More Economy in Brief
 Global| Feb 05 2026
Charts of the Week: Balanced Policy, Resilient Data and AI Narratives
by:Andrew Cates


