 Global| Apr 01 2008
ISM Factory Sector Index Ticked Higher But Still Was Below 50
by:Tom Moeller
|in:Economy in Brief
Summary
The Institute of Supply Management (ISM) reported that in March its Composite Index of Manufacturing Sector Activity ticked up to 48.6 from 48.3 in February. The rise exceeded Consensus expectations for a decline to 47.5. However, the [...]
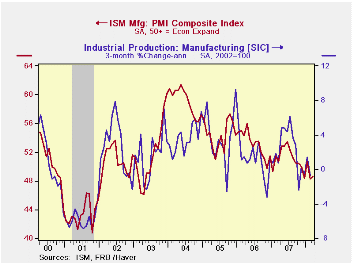
The Institute of Supply Management (ISM) reported that in March its Composite Index of Manufacturing Sector Activity ticked up to 48.6 from 48.3 in February. The rise exceeded Consensus expectations for a decline to 47.5. However, the index remained below the break even level for activity of 50 for the third month in the last four.
Last month's composite reading was down from 50.7 in January
and 48.4 in December. The three month average level of 49.2 remained
near its lowest since early 2003.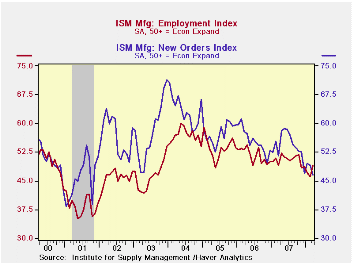
During the last twenty years there has been a 64% correlation between the level of the Composite Index and the three month growth in factory sector industrial production.
It is appropriate to correlate the ISM index level with factory sector growth because the ISM index is a diffusion index. It measures growth by being constructed using all of the absolute positive changes in activity added to one half of the no change in activity measures.
The employment index rose a sharp 3.2 points to 49.2 and made
up all of the declines during the prior two months. During the last
twenty years there has been a 67% correlation between the level of the
ISM employment Index and the three month growth in factory sector
employment. The supplier deliveries index also surged 3.5 points to its
highest level since late 2006.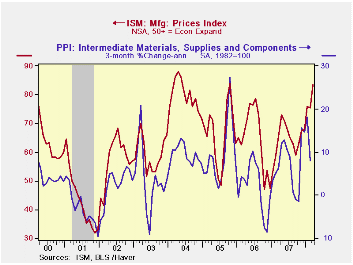
Three of the index's component series fell. The new orders index declined sharply to its lowest level since late in the recession year of 2001. Production also fell sharply to its lowest level since early 2003 and the inventory component slipped to its lowest level since last September.
The new export orders sub-series rose slightly by 0.5 points and recovered just a piece of a large 2.5 point February drop.
The prices paid index surged to its highest level since October 2005. During the last twenty years there has been a 77% correlation between the price index and the three month change in the PPI for intermediate goods.
The Economic Review 2008 from the Federal Reserve Bank of San Francisco is available here.
| ISM Mfg | March | February | March '07 | 2007 | 2006 | 2005 |
|---|---|---|---|---|---|---|
| Composite Index | 48.6 | 48.3 | 50.7 | 51.1 | 53.1 | 54.4 |
| New Orders Index | 46.5 | 49.1 | 51.5 | 54.3 | 55.4 | 57.4 |
| Employment Index | 49.2 | 46.0 | 49.2 | 50.5 | 51.7 | 53.6 |
| Prices Paid Index (NSA) | 83.5 | 75.5 | 65.5 | 64.6 | 65.0 | 66.4 |
by Tom Moeller April 1, 2008
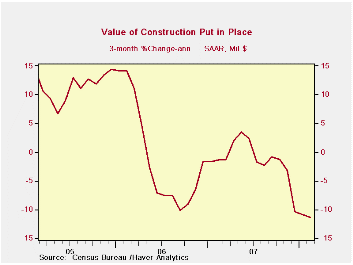
The value of construction put in place slipped 0.3% during February and January was revised to less of a decline of 1.0%. The latest decline was the fifth consecutive monthly drop and the level was 8.5% below the March 2006 peak.
The value of nonresidential building activity ticked down 0.1% after a 1.0% January decline which was half that reported initially. Momentum here recently has diminished substantially. Three month growth in activity is -5.3%. Education facility building slipped 0.2% (+17.3% y/y) after a 2.4% January surge. Spending in the factory sector rose 2.7% (27.4% y/y) and made up a revised 1.6% decline in January. Office construction fell 2.2% (+6.4% y/y) and commercial construction rose 2.6% (2.1% y/y).
The value of residential building activity fell another 0.9%.
Construction activity on new single family units collapsed an
additional 5.7% (-33.6% y/y). Building activity on multi-family units
also slipped 0.3% (-18.5% y/y) but spending on improvements surged 5.1%
(8.8% y/y).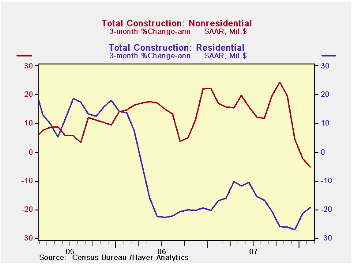
During the last twenty years there has been an 84% correlation between the q/q change in the value of residential building and its contribution to growth in real GDP.
Public construction spending rose a slight 0.4% for the second month. Construction on highways & streets rose 0.9% (3.7% y/y) after a very much upwardly revised 0.5% January increase. The value of construction on highways & streets is nearly one third of the value of total public construction spending. Building activity of educational facilities slipped 0.2% (+15.0% y/y).
These more detailed categories represent the Census Bureau’s reclassification of construction activity into end-use groups. Finer detail is available for many of the categories; for instance, commercial construction is shown for Automotive sales and parking facilities, drugstores, building supply stores, and both commercial warehouses and mini-storage facilities. Note that start dates vary for some seasonally adjusted line items in 2000 and 2002 and that constant-dollar data are no longer computed.
| Construction | February | January | Y/Y | 2007 | 2006 | 2005 |
|---|---|---|---|---|---|---|
| Total | -0.3% | -1.0% | -3.5% | -2.7% | 5.6% | 10.7% |
| Private | -0.5% | -1.5% | -7.1% | -6.8% | 4.7% | 12.0% |
| Residential | -0.9% | -1.9% | -18.8% | -18.1% | 0.5% | 13.7% |
| Nonresidential | -0.1% | -1.0% | 13.2% | 18.0% | 15.2% | 7.8% |
| Public | 0.4% | 0.4% | 8.2% | 12.2% | 9.2% | 6.2% |
by Tom Moeller April 1, 2008
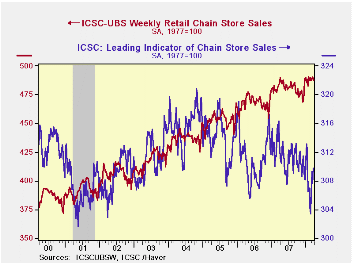
Chain store sales slipped another 0.2% last week, according to the International Council of Shopping Centers ICSC-UBS Chain Store survey. Together with the prior week's 0.4% slip, the two declines left sales in March essentially flat with the February average after 0.4% increase.
During the last ten years there has been a 45% correlation between the y/y change in chain store sales and the change in nonauto retail sales less gasoline.The ICSC-UBS retail chain-store sales index is constructed using the same-store sales (stores open for one year) reported by 78 stores of seven retailers: Dayton Hudson, Federated, Kmart, May, J.C. Penney, Sears and Wal-Mart.
During the latest week the leading indicator of chain store sales from ICSC-UBS surged 0.7% and recovered after the prior week's 0.5% decline.
Assessing Employment Growth in 2007 from the Federal Reserve Bank of San Francisco can be found here.
| ICSC-UBS (SA, 1977=100) | 03/29/08 | 03/22/08 | Y/Y | 2007 | 2006 | 2005 |
|---|---|---|---|---|---|---|
| Total Weekly Chain Store Sales | 487.5 | 488.3 | 0.5% | 2.8% | 3.3% | 3.6% |
by Louise Curley April 1, 2008
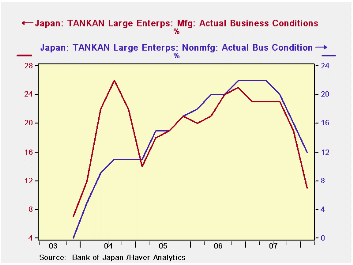
The Bank of Japan's Tankan Survey released today shows growing
concerns among large manufacturers and non manufacturers, as can be
seen in the first and second charts. The excess of optimists over
pessimists among large manufacturers appraising current conditions
declined to 11% from 19% in December. A slightly smaller decline was
registered for non manufacturers--12% from 16%. In looking to the
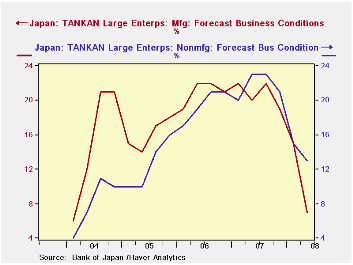
second quarter, the excess of optimists over pessimists among large
manufacturers dropped to 7%. For non manufacturers, the excess of
optimists dropped to 13%. One of the factors influencing the
manufacturers, in particular, has been the steep rise in the yen over
the past nine months, can be seen in the third chart.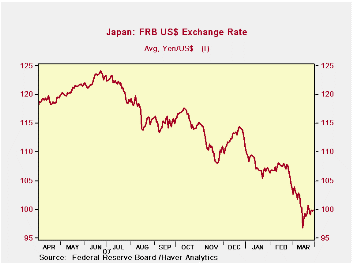
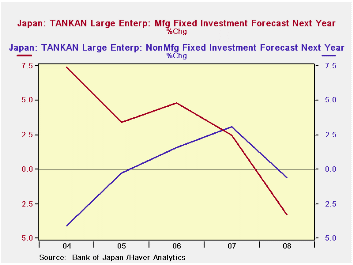
Among the most closely watched items in the Tankan survey are the forecasts of capital spending.In the current survey, manufacturers plan to increase capital spending in the current fiscal year ending last month, March, 2008 by 9.5% and non manufacturers by 5.2%. For next fiscal year ending March 2009, however, both large manufacturers and non manufacturers are planning to cut capital spending, the manufacturers by 3.3% and the non manufacturers by 0.6%, as can be seen in the fourth and fifth charts.
Much more detail from the Tankan can be found in the Haver Database, JAPAN. Data are available for medium and small enterprises and for specific industries as well as sales and profit expectations.
| JAPAN: TANKAN SURVEY | Q2 08 | Q1 08 | Q4 07 | Q3 07 | Q2 07 | 2007 | 2006 | 2005 |
|---|---|---|---|---|---|---|---|---|
| Actual Business Conditions (% balance) | ||||||||
| Large Manufacturing Co. | 11 | 19 | 23 | 23 | 22 | 23 | 18 | |
| Large Non manufacturing Co. | 12 | 16 | 20 | 22 | 20 | 20 | 15 | |
| Forecast of Business Conditions Next Quarter ( % balance) | ||||||||
| Large Manufacturing Co. | 7 | 15 | 19 | 22 | 20 | 21 | 21 | 16 |
| Large Non manufacturing Co. | 13 | 15 | 21 | 23 | 23 | 22 | 20 | 13 |
| Capital Spending % Change | Fiscal '07 | Fiscal '08 | ||||||
| Large Manufacturing Co. | 9.5 | -3.3 | -- | -- | -- | -- | -- | -- |
| Large Non manufacturing Co. | 5.2 | -0.6 | -- | -- | -- | -- | -- | -- |
by Robert Brusca April 1, 2008
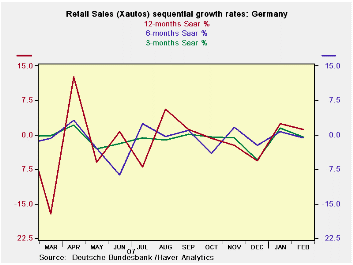
While German unemployment fell more than expected in March there has been no relief to German retailers or by association consumers. The growth rate series in the chart is remarkable for its tranquility. German real retail sales are simply flat after some turbulence early in 2007 stemming from the VAT tax that shifted sales into 2007 then sucked them out of 2008. Sales are settling down into a very narrow growth band in late 2007 and 2008. Even though Germany continues to post acceptable rates of growth, the consumer has long been forecast as a force to join in to extend the expansion but he simply has not. Indeed, real retail sales ex-auto sales (see table, at the bottom) fell sharply in February. Sales by this measure at the two-month mark in the new quarter are declining at a 1.3% annual rate. Real ex auto sales would have to rise by 1.6% in March to ‘elevate’ the quarter’s sales pace to zero.
| German Real and Nominal Retail Sales | ||||||||
|---|---|---|---|---|---|---|---|---|
| Nominal | Feb-08 | Jan-08 | Dec-07 | 3-MO | 6-MO | 12-MO | YrAGo | QTR, SAAR |
| Retaill Ex auto | -0.7% | 1.6% | -0.6% | 1.2% | -0.6% | -0.5% | -0.4% | 3.4% |
| Motor Vehicle and Parts | #N/A | -3.8% | 2.9% | #N/A | #N/A | #N/A | -4.7% | #N/A |
| Food, Beverages & Tobacco | -2.2% | 2.1% | -2.3% | -9.1% | -4.5% | -3.9% | -0.3% | -5.1% |
| Clothing footwear | 2.5% | 1.6% | 0.8% | 21.6% | 4.4% | 4.0% | 3.6% | 16.0% |
| Real | ||||||||
| Retail Ex auto | -1.6% | 0.9% | -0.1% | -3.2% | -5.0% | -3.2% | -0.9% | -1.3% |

Tom Moeller
AuthorMore in Author Profile »Prior to joining Haver Analytics in 2000, Mr. Moeller worked as the Economist at Chancellor Capital Management from 1985 to 1999. There, he developed comprehensive economic forecasts and interpreted economic data for equity and fixed income portfolio managers. Also at Chancellor, Mr. Moeller worked as an equity analyst and was responsible for researching and rating companies in the economically sensitive automobile and housing industries for investment in Chancellor’s equity portfolio. Prior to joining Chancellor, Mr. Moeller was an Economist at Citibank from 1979 to 1984. He also analyzed pricing behavior in the metals industry for the Council on Wage and Price Stability in Washington, D.C. In 1999, Mr. Moeller received the award for most accurate forecast from the Forecasters' Club of New York. From 1990 to 1992 he was President of the New York Association for Business Economists. Mr. Moeller earned an M.B.A. in Finance from Fordham University, where he graduated in 1987. He holds a Bachelor of Arts in Economics from George Washington University.
More Economy in Brief


