 Global| Aug 03 2009
ISM Factory Sector Index ReachesIts Highest Level In Nearly One Year
by:Tom Moeller
|in:Economy in Brief
Summary
Though overall activity declined again last month, the recession in the factory sector continued to moderate, according to The National Association of Purchasing Management. Its July composite index rose to 48.9 from an unrevised June [...]
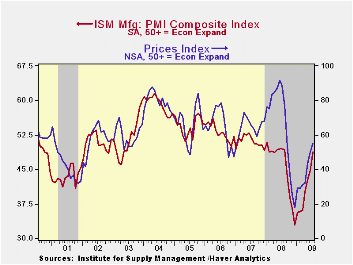 Though
overall activity declined again last month, the recession in the
factory sector continued to moderate, according to The National
Association of Purchasing Management. Its July composite index rose to
48.9 from an unrevised June reading of 44.8 and reached it's highest
level since August of last year. The August figure was up from the low
of 32.9 hit last December. (Any reading below the break-even point of
50 suggests declining activity.) The July figure about matched
Consensus expectations. The ISM data is available in Haver's USECON
database.
Though
overall activity declined again last month, the recession in the
factory sector continued to moderate, according to The National
Association of Purchasing Management. Its July composite index rose to
48.9 from an unrevised June reading of 44.8 and reached it's highest
level since August of last year. The August figure was up from the low
of 32.9 hit last December. (Any reading below the break-even point of
50 suggests declining activity.) The July figure about matched
Consensus expectations. The ISM data is available in Haver's USECON
database.
Improvement in the components of the overall
June ISM index again was broad-based. The production component surged
to 57.9, up from the low of 26.3 in December, and was at its highest
since June of 2007. During the last ten years there has been an 84%
correlation between the level of the production component of the
composite index and the three-month growth in factory sector industrial
production. 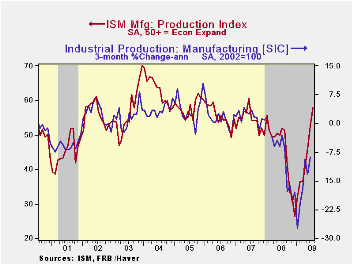 It is appropriate to correlate the ISM index level
with factory sector output growth because the ISM
index is a diffusion index. It measures growth by using all of the
positive changes in activity added to one half of the zero change in
activity measures.· The new orders figure also jumped sharply
to the highest level in nearly two years. At 55.3 it was up from the
December low of 23.1. Suggesting some stabilization in the recessions
abroad was a modest rise in the export order index to 50.5 versus the
December low of 35.5. During the last ten years there has been a 53%
correlation between the index and the q/q change in real exports of
goods in the GDP accounts.
It is appropriate to correlate the ISM index level
with factory sector output growth because the ISM
index is a diffusion index. It measures growth by using all of the
positive changes in activity added to one half of the zero change in
activity measures.· The new orders figure also jumped sharply
to the highest level in nearly two years. At 55.3 it was up from the
December low of 23.1. Suggesting some stabilization in the recessions
abroad was a modest rise in the export order index to 50.5 versus the
December low of 35.5. During the last ten years there has been a 53%
correlation between the index and the q/q change in real exports of
goods in the GDP accounts.
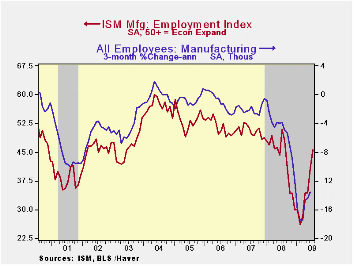
Factory sector improvement also was indicated by a rise in the employment index. The jump to 45.6 was to its highest level since last August and that was up from the February low of 26.1. During the last ten years there has been a 90% correlation between the index level and the three-month change in manufacturing payrolls.
 The rate
of inventory destocking picked finally may have
stabilized as indicated by a modest rise in the inventory index to
33.5. It still was near the lowest level since 1982. That improvement
brought with it another decline in the speed of supplier deliveries. At
52.0, the vendor performance index rose for the fourth consecutive
month to its highest level in one year.
The rate
of inventory destocking picked finally may have
stabilized as indicated by a modest rise in the inventory index to
33.5. It still was near the lowest level since 1982. That improvement
brought with it another decline in the speed of supplier deliveries. At
52.0, the vendor performance index rose for the fourth consecutive
month to its highest level in one year.
The separate index of prices paid again rose with improved factory sector activity levels. At 55.0, the reading above the break-even level of 50 was its highest since last August and it's up from the December low of 18.0. During the last twenty years there has been a 79% correlation between the price index and the three-month change in the PPI for intermediate goods.
Below The Line: Estimates of Negative Equity Among Nonprime Mortgage Borrowers from the Federal Reserve Bank of New York can be found here.
| ISM Mfg | July | June | June '08 | 2008 | 2007 | 2006 |
|---|---|---|---|---|---|---|
| Composite Index | 48.9 | 44.8 | 49.5 | 45.5 | 51.1 | 53.1 |
| New Orders Index | 55.3 | 49.2 | 44.9 | 42.1 | 54.3 | 55.4 |
| Employment Index | 45.6 | 40.7 | 51.0 | 43.2 | 50.5 | 51.7 |
| Prices Paid Index (NSA) | 55.0 | 50.0 | 88.5 | 66.5 | 64.6 | 65.0 |
by Tom Moeller August 3, 2009
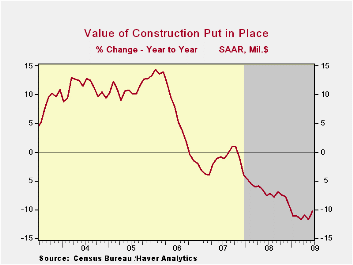
It's been a long time coming, but a bottoming of the two-year decline in construction outlays arrived in 2008. During June, the value of overall construction put-in-place ticked up 0.3% after a little-revised 0.8% May slip, and the latest beat expectations for a 0.5% decline. More to the point, however, was that outlays through June versus January fell just 2.1% (AR) versus the 9.9% three-month rate of decline through January.
Private nonresidential building outlays continued to support overall construction activity. Though the monthly increases so far this year have been small, the gains versus January lead to an 8.6% annual rate of growth and that reverses the decline through the beginning of this year.Spending in virtually all sectors has turned positive, notably in the education, health care and transportation areas. The rate of decline in office construction also has moderated but still is quite negative.
The best that can be pointed out about residential building
activity is that there was a 0.5% uptick in June, but that only
lessened the negative growth rate this year to -25.9%, half that at its
worst. Single-family home construction is down by nearly half from its
January level while multi-family construction fell the same 7% it did
did in May (-33.1% y/y).Spending on improvements reversed all of a 1.2%
May decline and have risen at a 12.3% annual rate since January.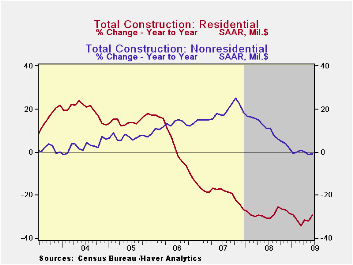
Public construction activity was firm again during June and the 1.0% gain lifted spending since January at quite-strong 17.9% rate since January. The increase has been led by strong gains in the heath care (24.0% y/y), educational (4.6% y/y) and transportation (+1.0% y/y) areas.
The construction put-in-place figures are available in Haver's USECON database.
| Construction (%) | June | May | Y/Y | 2008 | 2007 | 2006 |
|---|---|---|---|---|---|---|
| Total | 0.3 | -0.8 | -10.2 | -6.9 | -1.6 | 6.3 |
| Private | -0.1 | -1.4 | -16.3 | -11.1 | -5.7 | 5.5 |
| Residential | 0.5 | -3.1 | -30.0 | -29.1 | -19.7 | 1.0 |
| Nonresidential | -0.5 | -0.4 | -4.8 | 13.2 | 23.1 | 16.2 |
| Public | 1.0 | 0.4 | 5.1 | 5.6 | 13.1 | 9.3 |
by Robert Brusca August 3, 2009
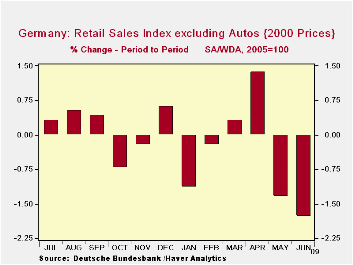
The FACT: German ex-auto retail sales fell
sharply in June, the second sharp drop in a row after posting a strong
gain in April.
THE REVERSAL: After a terrible January
German non-auto retail sales have been on a nice strong recovery path
as sales cut their decline of over 1% (m/m) in January to drop of -0.2%
in February then rose in March and rose strongly in April by 1.8%. That
was before this new episode in which they have posted back to back
large drops in May and in June.
THE IMPACT: Despite the disappointing
numbers in the last two months, earlier increases will hold retail
sales ex-autos flat in real terms; the nominal numbers will rise by
1.7% at an annual rate in Q2.
THE PARADOX: The retail sales report was a
bitter one for June and it comes in a day that Europe-wide and German
MFG PMI results we better-than-expected. The EMU report registered its
second highest month-to-month gain in its relatively modest history-
still an impressive jump. The German MFG reading rose to 45.7 on its
largest point gain ever, reaching a ten-month high, although still
indicating a declining state. All of that is impressive.
THE UPSHOT: So the day’s reports are mixed.
In Europe and in Germany manufacturing is making a strong step toward
recovery. Still, the level of the reading tells us that the strong
month-to-month improvement leaves industry output contracting. The
retailing sector that had begun to look like it was in a state of
repair is now looking much worse. While the quarter will not end too
badly for German retail sales that is because of past strength. The
recent collapse in retail sales should be a warning to policymakers
about complacency – even in the face of a manufacturing turnaround that
is in progress.
THE FUTURE: The new bout of retail weakness
puts retail sales in a deep hole from which to start off in 2009-Q3.
For example if German retail sales do not rise in July they will carry
a growth rate off the previous quarter of -6.4% at annual rate in Q3
over Q2. This is a big inherited weakness that is unlikely to spur any
increase in the output of consumer goods in Germany – setting aside the
auto sector where special incentives are having a positive impact. The
optimistic spin here is that all of consumer attention is going into
the auto incentives and that is leaving other retail behind. Things may
not be as weak as they seem by looking at non-auto retail sales alone.
That may be true, but that is only a matter of solace if attention and
spending in the non-auto sector turns up, because it is starting off Q3
in a really deep hole. The auto sales revival in Q2 will only make it
that much more difficult to get Q3 sales higher. In other words if the
auto incentives don’t stay in place and do not continue to have a
strong positive impact, German overall retail sales will become a heavy
negative weight on German GDP in Q3.
| German Real and Nominal Retail Sales | QTR | |||||||
|---|---|---|---|---|---|---|---|---|
| Nominal | Jun-09 | May-09 | Apr-09 | 3-MO | 6-MO | 12-MO | Year Ago | Saar |
| Retail Ex auto | -1.6% | -1.4% | 1.8% | -4.7% | -3.9% | -2.2% | 1.6% | 1.7% |
| Real | ||||||||
| Retail Ex auto | -1.8% | -1.3% | 1.4% | -6.9% | -5.5% | -1.9% | -1.7% | 0.0% |
by Louise Curley August 3, 2009
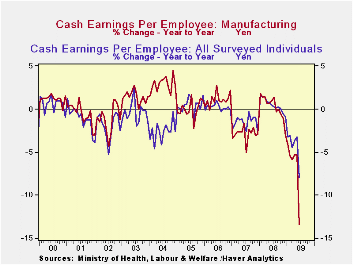
Cash earnings, including bonuses, for Japanese workers in all establishments of 5 or more persons were 430,620 Yen (approximately $4,500) in June, 8% below a year ago. The sharp decline was due to lower bonuses and less overtime pay. The average bonus in June of this year was 167,044 yen compared with 197,226 yen last June, a decline of more than 15%. Overtime pay was 15,725 yen compared with 19,275 yen a year ago, a decline of 18.42% and, although the decline was small, even base pay declined 1.4% to 247,851 yen from 251,437 yen a year ago.
Cash earnings in the manufacturing industry in establishments of 5 or more persons were down over 13% in June. Again, bonuses were the major cause of the decline. Bonuses in Manufacturing were 155,298 yen in June 2009, compared with 209,309 yen in June 2008, a drop of almost 40%. In contrast to industry as a whole, manufacturing saw an increase in base pay of 1.5% and an increase of 5.7% in overtime from May to June.
Total cash wages for all surveyed industries and for manufacturing are shown in the attached chart.
| Japan Wages (Average monthly data in yen) | Jun 09 | May 09 | Jun 08 | M/M % | Y/Y % | 2008 | 2007 | 2006 |
|---|---|---|---|---|---|---|---|---|
| All Industries | ||||||||
| Schedule wages | 247851 | 242451 | 251437 | 1.39 | -1.43 | 251069 | 249749 | 252809 |
| Overtime | 15725 | 15940 | 19275 | -1.35 | -18.42 | 19147 | 19753 | 19805 |
| Total=Contractual Wages | 263576 | 260391 | 270712 | 1.22 | -2.64 | 270515 | 2695B02 | 272614 |
| Bonuses | 167044 | 7928 | 197226 | n.m. | -15.30 | 60538 | 60396 | 62844 |
| Total Cash Wages | 430620 | 268319 | 467938 | n.m | -7.97 | 331053 | 329898 | 335438 |
| Manufacturing | ||||||||
| Schedule wages | 267443 | 263356 | 269229 | 1.55 | -0.66 | 267625 | 265482 | 271803 |
| Overtime | 19424 | 18351 | 31988 | 5.69 | -39.28 | 30963 | 33025 | 34168 |
| Total=Contractual Wages | 286867 | 281737 | 301217 | 1.82 | -4.76 | 298588 | 298507 | 305972 |
| Bonuses | 155298 | 5836 | 209309 | n.m. | -25.80 | 75644 | 75664 | 59515 |
| Total Cash Wages | 442165 | 287573 | 510526 | n.m. | -13.39 | 374231 | 374171 | 385487 |
| N.M. presented in the table is because of the distortions in the monthly data due to the distribution of Bonuses in mid and end years, the month to month data for bonuses and total cash wages are not meaningful | ||||||||
by Tom Moeller August 3, 2009
 The U.S. government's "Cash for Clunkers" program was given
credit for supporting sales of light vehicles last month. The program
gives car buyers up to $4,500 for trading in older, gas-guzzling
vehicles if they're buying more fuel efficient cars. The Treasury Dept.
was authorized to spend $1 billion and an additional $2 billion
currently is under consideration by the Senate. The House passed its
approval of the plan on Friday. One estimate is that, just last week,
the program helped spike vehicle sales to a 15-to-16 million annual
rate. Regardless of the program's impact, U.S. light vehicle
sales last month jumped 15.8%
The U.S. government's "Cash for Clunkers" program was given
credit for supporting sales of light vehicles last month. The program
gives car buyers up to $4,500 for trading in older, gas-guzzling
vehicles if they're buying more fuel efficient cars. The Treasury Dept.
was authorized to spend $1 billion and an additional $2 billion
currently is under consideration by the Senate. The House passed its
approval of the plan on Friday. One estimate is that, just last week,
the program helped spike vehicle sales to a 15-to-16 million annual
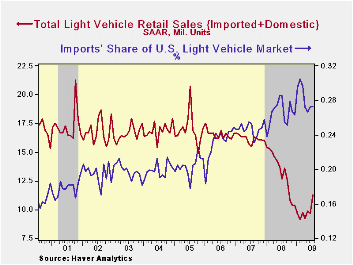
rate. Regardless of the program's impact, U.S. light vehicle
sales last month jumped 15.8% 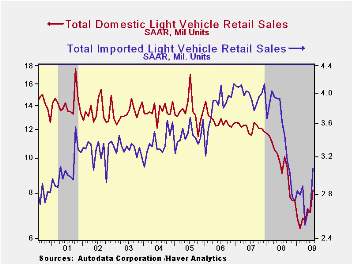 from June to 11.24 million
units (AR) which was the highest sales rate since last September. It
followed a 1.6% decline during June. While sales were firm last month,
they remained down by nearly one-third, year-to-date, from the first
seven months of 2008. (Benchmark revisions altered sales levels
slightly back to 2002.)
from June to 11.24 million
units (AR) which was the highest sales rate since last September. It
followed a 1.6% decline during June. While sales were firm last month,
they remained down by nearly one-third, year-to-date, from the first
seven months of 2008. (Benchmark revisions altered sales levels
slightly back to 2002.)
Unit sales of U.S. made light vehicles jumped 15.8% m/m to 8.17M units during July which was their highest since last September, according to the Autodata Corporation. (Seasonal adjustment of the figures is provided by the U.S. Bureau of Economic Analysis). Sales of domestically made cars jumped 25.4% m/m to 4.11M units while light truck sales rose 7.4% m/m to 4.06M units. YTD, sales of domestic vehicles overall are down 33.6% following last year's 35.8% drop from December-to-December.
In similar fashion, sales of imported light vehicles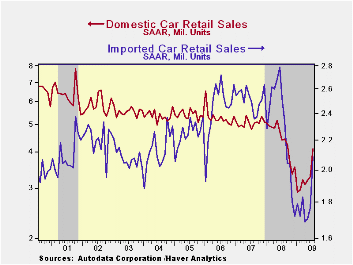 were strong and rose 16.0% m/m during July from June. Sales of imported
autos rose 18.3% from June and were at their highest level since last
August. Sales of imported light trucks were nearly as strong m/m, up
11.3% from June, but they've really been strong all year rising to
their highest just since March. Sales of imported vehicles YTD have
increased 12.5%.
were strong and rose 16.0% m/m during July from June. Sales of imported
autos rose 18.3% from June and were at their highest level since last
August. Sales of imported light trucks were nearly as strong m/m, up
11.3% from June, but they've really been strong all year rising to
their highest just since March. Sales of imported vehicles YTD have
increased 12.5%.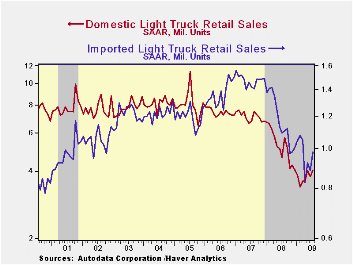
Overall, import's share of the U.S. light vehicle market held steady at 27.3% last month after reaching 26.5% during all of last year. (Imported vehicles are those produced outside the United States.) Imports' share of the U.S. car market totaled 33.7% while the share of the light truck market was 19.5%, up slightly from last year.
The U.S. vehicle sales figures can be found in Haver's USECON database.
| Light Vehicle Sales (SAAR, Mil. Units) | July | June | May | July Y/Y | 2008 | 2007 | 2006 |
|---|---|---|---|---|---|---|---|
| Total | 11.24 | 9.70 | 9.86 | -11.4% | 13.17 | 16.16 | 16.54 |
| Autos | 6.20 | 5.04 | 4.89 | -10.7 | 6.71 | 7.58 | 7.77 |
| Domestic | 4.11 | 3.28 | 3.19 | -7.0 | 4.42 | 5.07 | 5.31 |
| Imported | 2.09 | 1.76 | 1.71 | -17.3 | 2.29 | 2.52 | 2.45 |
| Light Trucks | 5.04 | 4.66 | 4.37 | -12.2 | 6.47 | 8.60 | 8.78 |
| Domestic | 4.06 | 3.78 | 4.05 | -12.6 | 5.29 | 7.10 | 7.42 |
| Imported | 0.98 | 0.88 | 0.92 | -10.4 | 1.18 | 1.47 | 1.37 |

Tom Moeller
AuthorMore in Author Profile »Prior to joining Haver Analytics in 2000, Mr. Moeller worked as the Economist at Chancellor Capital Management from 1985 to 1999. There, he developed comprehensive economic forecasts and interpreted economic data for equity and fixed income portfolio managers. Also at Chancellor, Mr. Moeller worked as an equity analyst and was responsible for researching and rating companies in the economically sensitive automobile and housing industries for investment in Chancellor’s equity portfolio. Prior to joining Chancellor, Mr. Moeller was an Economist at Citibank from 1979 to 1984. He also analyzed pricing behavior in the metals industry for the Council on Wage and Price Stability in Washington, D.C. In 1999, Mr. Moeller received the award for most accurate forecast from the Forecasters' Club of New York. From 1990 to 1992 he was President of the New York Association for Business Economists. Mr. Moeller earned an M.B.A. in Finance from Fordham University, where he graduated in 1987. He holds a Bachelor of Arts in Economics from George Washington University.
More Economy in Brief


