 Global| Dec 01 2004
ISM Factory Index Up
by:Tom Moeller
|in:Economy in Brief
Summary
The Composite Index of activity in the manufacturing sector from the Institute of Supply Management rose a point last month to 57.8 versus Consensus expectations for little change at 57.0. During the last twenty years there has been a [...]
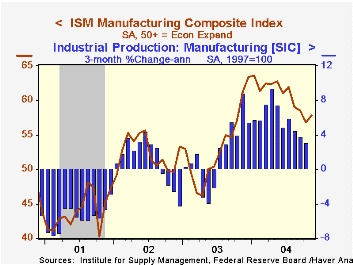
The Composite Index of activity in the manufacturing sector from the Institute of Supply Management rose a point last month to 57.8 versus Consensus expectations for little change at 57.0.
During the last twenty years there has been a 70% correlation between the level of the Composite Index and the three month growth in factory sector industrial production.
The Composite Index reflected gains in the new orders (61.5), employment (57.6) and inventory (50.7) components.
The separate index of export orders fell and reversed nearly half of the prior month's rise.
The prices paid index fell, and at 74.0 was well off the year's high of 88.0.
"Using Manufacturing Surveys to Access Economic Conditions" from the Federal Reserve Bank of Richmond is available here.
| ISM Manufacturing Survey | Nov | Oct | Nov '03 | 2003 | 2002 | 2001 |
|---|---|---|---|---|---|---|
| Composite Index | 57.8 | 56.8 | 61.3 | 53.3 | 52.4 | 43.9 |
| New Orders Index | 61.5 | 58.3 | 71.4 | 58.1 | 56.6 | 46.1 |
| Prices Paid Index (NSA) | 74.0 | 78.5 | 64.0 | 59.6 | 57.6 | 42.9 |
by Tom Moeller December 1, 2004
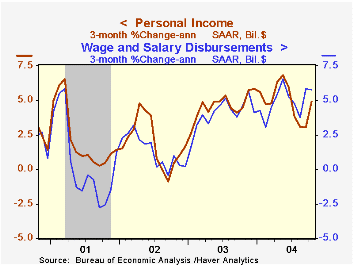
Personal income rebounded 0.6% in October from a light 0.2% gain the month prior. Proprietors' income surged 1.9% (6.5%y/y) after declines during the three prior months. Consensus expectations had been for a 0.5% October rise in total income.
Wages & salaries rose 0.6% (+5.1% y/y), the most for any one month since July. Strength reflected a 0.7% (6.0% y/y) gain in private service producing industry wages while manufacturing wages fell 0.2% (+2.4% y/y).
Personal disposable income rose 0.6% (5.2% y/y). Adjusted for inflation disposable income gained 0.2% (2.7% y/y).
"US Consumers and Electronic Banking, 1995-2003" from the Federal Reserve Board can be found here.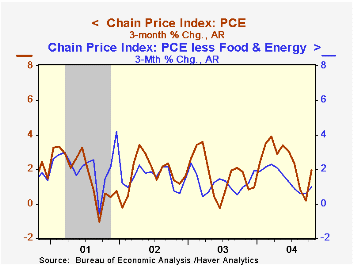
Personal consumption again was strong, up 0.7% following a 0.6% September rise. A 1.5% jump in non-durable goods spending reflected higher prices for gasoline.Adjusted for price inflation, total PCE rose 0.3% (4.1% y/y).
The PCE chain price index rose 0.4%, the strongest monthly increase since May. Less food & energy, prices edged up another 0.1% (1.5% y/y).
| Disposition of Personal Income | Oct | Sept | Y/Y | 2003 | 2002 | 2001 |
|---|---|---|---|---|---|---|
| Personal Income | 0.6% | 0.2% | 5.2% | 3.2% | 1.8% | 3.5% |
| Personal Consumption | 0.7% | 0.6% | 6.6% | 5.2% | 4.6% | 4.7% |
| Savings Rate | 0.2% | 0.3% | 1.5% | 1.4% | 2.0% | 1.8% |
| PCE Chain Price Index | 0.4% | 0.1% | 2.4% | 1.9% | 1.4% | 2.1% |
by Tom Moeller December 1, 2004
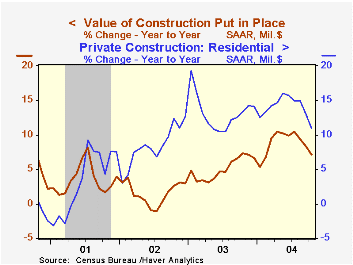
The total value of construction put in place remained stalled in October for the third straight month versus the Consensus expectation for a 0.7% rise.
Private residential building activity fell 0.3% for the second consecutive month as new single family building slipped (+14.4% y/y).
"Housing and the Business Cycle" from the Federal Reserve Board can be found here.
Nonresidential building also slipped 0.4% (+2.5% y/y) but so far this year has risen 3.8% due to huge gains in lodging (+42.8%) and retail 29.2%).
Public construction jumped 1.2% as spending on highways & streets, nearly one third of the value of public construction spending, recovered 6.4% (4.9% y/y).
These more detailed categories represent the Census Bureau’s reclassification of construction activity into end-use groups. Finer detail is available for many of the categories; for instance, commercial construction is shown for Automotive sales and parking facilities, drugstores, building supply stores, and both commercial warehouses and mini-storage facilities. Note that start dates vary for some seasonally adjusted line items in 2000 and 2002 and that constant-dollar data are no longer computed.
| Construction Put-in-place | Oct | Sept | Y/Y | 2003 | 2002 | 2001 |
|---|---|---|---|---|---|---|
| Total | 0.0% | 0.1% | 7.1% | 5.1% | 1.5% | 3.5% |
| Private | -0.3% | -0.1% | 8.3% | 6.0% | -0.2% | 1.4% |
| Residential | -0.3% | -0.3% | 10.9% | 13.1% | 8.4% | 3.3% |
| Nonresidential | -0.4% | 0.2% | 2.5% | -7.1% | -12.8% | -1.3% |
| Public | 1.2% | 0.9% | 3.5% | 2.6% | 7.0% | 10.7% |
by Tom Moeller December 1, 2004
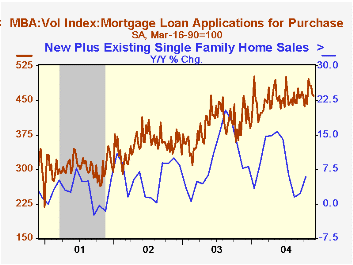
Mortgage applications dropped another 5.8% last week, the third sharp w/w decline in November. The decline lowered the average level of activity in November to just 1.0% above October according to the Mortgage Bankers Association (MBA).
Applications to refinance plunged 12.3% w/w, pulling the November average 1.3% below October.
Purchase applications slipped 0.6% after a 3.5% decline the prior week. The November average was up versus 2.8% versus October. During the last ten years there has been a 59% correlation between the y/y change in purchase applications and the change in new plus existing home sales.
The effective interest rate on a conventional 30-year mortgage rose to 6.03% and averaged 5.97% last month versus 5.92% in October. The effective rate on a 15-year mortgage rose to 5.49%, the highest level since early October.
The Mortgage Bankers Association surveys between 20 to 35 of the top lenders in the U.S. housing industry to derive its refinance, purchase and market indexes. The weekly survey accounts for more than 40% of all applications processed each week by mortgage lenders. Visit the Mortgage Bankers Association site here.
| MBA Mortgage Applications (3/16/90=100) | 11/26/04 | 11/19/04 | Y/Y | 2003 | 2002 | 2001 |
|---|---|---|---|---|---|---|
| Total Market Index | 673.3 | 715.0 | -1.7% | 1,067.9 | 799.7 | 625.6 |
| Purchase | 460.3 | 463.3 | 4.2% | 395.1 | 354.7 | 304.9 |
| Refinancing | 1,912.3 | 2,179.3 | -8.9% | 4,981.8 | 3,388.0 | 2,491.0 |

Tom Moeller
AuthorMore in Author Profile »Prior to joining Haver Analytics in 2000, Mr. Moeller worked as the Economist at Chancellor Capital Management from 1985 to 1999. There, he developed comprehensive economic forecasts and interpreted economic data for equity and fixed income portfolio managers. Also at Chancellor, Mr. Moeller worked as an equity analyst and was responsible for researching and rating companies in the economically sensitive automobile and housing industries for investment in Chancellor’s equity portfolio. Prior to joining Chancellor, Mr. Moeller was an Economist at Citibank from 1979 to 1984. He also analyzed pricing behavior in the metals industry for the Council on Wage and Price Stability in Washington, D.C. In 1999, Mr. Moeller received the award for most accurate forecast from the Forecasters' Club of New York. From 1990 to 1992 he was President of the New York Association for Business Economists. Mr. Moeller earned an M.B.A. in Finance from Fordham University, where he graduated in 1987. He holds a Bachelor of Arts in Economics from George Washington University.
More Economy in Brief


