 Global| Apr 01 2004
ISM Factory Index Rose Unexpectedly
by:Tom Moeller
|in:Economy in Brief
Summary
The Purchasing Managers Composite Index (PMI) for March released by the Institute of Supply Management rose to 62.5 from 61.4 in February. Consensus expectations were for a decline to 60.0. During the last twenty years there has been [...]
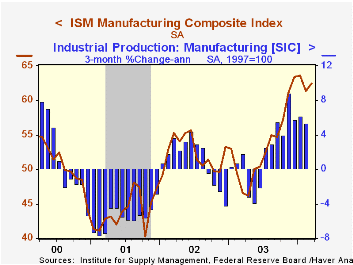
The Purchasing Managers’ Composite Index (PMI) for March released by the Institute of Supply Management rose to 62.5 from 61.4 in February. Consensus expectations were for a decline to 60.0.
During the last twenty years there has been a 71% correlation between the level of the Composite Index and the three month growth in factory sector industrial production. There has been a 56% correlation between the level of the Composite Index and quarterly growth in real GDP.
Higher readings for production (65.5 vs. 63.9) and employment (57.0 vs. 56.3) led the composite index higher. The index of vendor deliveries also rose to 67.9, indicating the slowest pace of vendor deliveries since April 1979.
The new orders index fell modestly to 65.7 and the inventory index fell 48.3 from 49.4.
The prices paid index surged to 86.0, the highest level since March 1980.
| ISM Manufacturing Survey | Mar | Feb | Mar '03 | 2003 | 2002 | 2001 |
|---|---|---|---|---|---|---|
| Composite Index | 62.5 | 61.4 | 46.6 | 53.3 | 52.4 | 43.9 |
| New Orders Index | 65.7 | 66.4 | 47.1 | 58.1 | 56.6 | 46.1 |
| Prices Paid Index (NSA) | 86.0 | 81.5 | 70.0 | 59.6 | 57.6 | 42.9 |
by Tom Moeller April 1, 2004
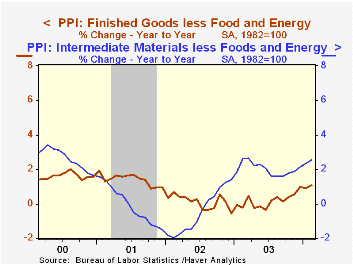
Finished producer prices edged just 0.1% higher in February following a 0.6% spurt the prior month. The core PPI also rose a tame 0.1% on the heels of a 0.3% January rise. A 0.3% increase in the finished goods PPI and a 0.1% rise in the core had been the Consensus expectation.
Finished consumer goods prices rose just 0.1% after the 0.7% January spurt. Less food & energy finished consumer goods prices were unchanged (+1.0% y/y). Consumer durable prices fell 0.2% (+0.9% y/y) and core non-durable prices rose the same 0.2% as in January (1.0% y/y). Finished capital goods prices were unchanged (+1.1% y/y).
Strength in February was evident at the intermediate goods level where prices rose 0.9% after a 0.8% January spurt. Core intermediate prices surged 0.9%, the most for any month since January 1995. Prices for intermediate materials for durable manufacturing spiked 3.5% (8.0% y/y) and prices for construction components jumped 1.4% (4.1% y/y).
Crude goods prices spiked another 2.5%, led by a 5.5% surge in the core crude price measure. Higher prices for iron & steel scrap, up 19.2% m/m and 88.1% y/y, have been quite strong due to the recovery in the factory sector. Copper prices also surged 12.2% (45.9% y/y).
Finished energy prices rose just 0.2% (3.8% y/y) in February and finished foods prices were up a like 0.2% (4.1% y/y).
| Producer Price Index | Feb | Jan | Y/Y | 2003 | 2002 | 2001 |
|---|---|---|---|---|---|---|
| Finished Goods | 0.1% | 0.6% | 2.1% | 3.2% | -1.3% | 2.0% |
| Core | 0.1% | 0.3% | 1.1% | 0.2% | 0.1% | 1.4% |
| Intermediate Goods | 0.9% | 0.8% | 2.7% | 4.7% | -1.5% | 0.4% |
| Core | 0.9% | 0.6% | 2.5% | 2.0% | -0.5% | -0.1% |
| Crude Goods | 2.5% | 2.8% | 10.7% | 25.0% | -10.6% | 0.3% |
| Core | 5.5% | 3.3% | 26.2% | 12.3% | 3.8% | -10.0% |
by Tom Moeller April 1, 2004
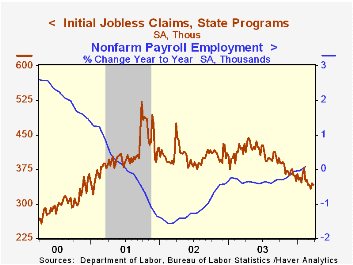
Initial claims for jobless insurance dipped 3,000 last week to 342,000 but the prior week's level was revised up sharply. The Consensus expectations had been for 340,000 claims.
The 4-week moving average of initial claims was unchanged at 340,250 (-19.1% y/y).
Continuing claims for unemployment insurance rose 32,000 in the latest week following a little-revised 47,000 drop the week prior.
The insured rate of unemployment was unchanged at 2.4%.
Comments from Federal Reserve Board Governor Ben S. Bernanke on "Trade and Jobs" can be found here.
| Unemployment Insurance (000s) | 3/27/04 | 3/20/04 | Y/Y | 2003 | 2002 | 2001 |
|---|---|---|---|---|---|---|
| Initial Claims | 342 | 345 | -20.8% | 403 | 404 | 406 |
| Continuing Claims | -- | 3,062 | -14.3% | 3,533 | 3,573 | 3,023 |
by Tom Moeller April 1, 2004
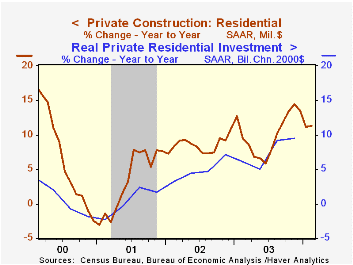
The value of total construction put in place fell 0.1% in February and the previously reported 0.3% January decline was deepened to -0.8% due to lowered figures for residential and public building. No change was expected by the Consensus.
Private residential building activity fell moderately for the second consecutive month led by modest declines in single family home building (16.8% y/y). Construction on multi-family homes ticked up 1.0% (0.3% y/y) following four months of decline.
Nonresidential building rose 1.1% after a 1.8% January flop. Office building recovered just 0.3% of a 5.0% January plunge (2.7% y/y) but the health care (-2.4% y/y) and educational (+3.7% y/y) categories moved up more.
These more detailed categories represent the Census Bureau’s reclassification of construction activity into end-use groups. Finer detail is available for many of the categories; for instance, commercial construction is shown for Automotive sales and parking facilities, drugstores, building supply stores, and both commercial warehouses and mini-storage facilities. Note that start dates vary for some seasonally adjusted line items in 2000 and 2002 and that constant-dollar data are no longer computed.
| Construction Put-in-place | Feb | Jan | Y/Y | 2003 | 2002 | 2001 |
|---|---|---|---|---|---|---|
| Total | -0.1% | -0.8% | 5.1% | 4.0% | 1.1% | 2.7% |
| Private | 0.1% | -0.7% | 7.5% | 4.6% | -0.2% | 1.4% |
| Residential | -0.3% | -0.2% | 11.3% | 10.1% | 8.6% | 3.3% |
| Nonresidential | 1.1% | -1.8% | -0.4% | -5.5% | -13.0% | -1.3% |
| Public | -1.0% | -1.4% | -2.5% | 2.1% | 5.3% | 7.4% |

Tom Moeller
AuthorMore in Author Profile »Prior to joining Haver Analytics in 2000, Mr. Moeller worked as the Economist at Chancellor Capital Management from 1985 to 1999. There, he developed comprehensive economic forecasts and interpreted economic data for equity and fixed income portfolio managers. Also at Chancellor, Mr. Moeller worked as an equity analyst and was responsible for researching and rating companies in the economically sensitive automobile and housing industries for investment in Chancellor’s equity portfolio. Prior to joining Chancellor, Mr. Moeller was an Economist at Citibank from 1979 to 1984. He also analyzed pricing behavior in the metals industry for the Council on Wage and Price Stability in Washington, D.C. In 1999, Mr. Moeller received the award for most accurate forecast from the Forecasters' Club of New York. From 1990 to 1992 he was President of the New York Association for Business Economists. Mr. Moeller earned an M.B.A. in Finance from Fordham University, where he graduated in 1987. He holds a Bachelor of Arts in Economics from George Washington University.
More Economy in Brief


