 Global| Jun 01 2005
ISM Factory Index Fell Again
by:Tom Moeller
|in:Economy in Brief
Summary
In a move foreshadowed by earlier reports from regions around the US, the May Composite Index of activity in the manufacturing sector compiled by the Institute of Supply Management fell another 1.9 points to 51.4. The index has fallen [...]
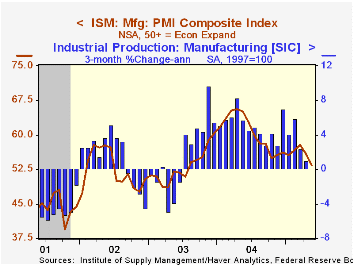
In a move foreshadowed by earlier reports from regions around the US, the May Composite Index of activity in the manufacturing sector compiled by the Institute of Supply Management fell another 1.9 points to 51.4. The index has fallen steadily from the peak of 62.8 in January 2004. Consensus expectations had been for a lesser decline to 52.5.
During the last twenty years there has been a 64% correlation between the level of the Composite Index and the three month growth in factory sector industrial production.
A lower new orders (51.7) component led the composite down for the fourth month this year while the index of export orders (54.9) fell to its lowest since September.
The employment index (48.8) fell below the break even level of 50 for the first month since October 2003. During the last twenty years there has been a 67% correlation between the level of the ISM Employment Index and the three month growth in factory sector employment.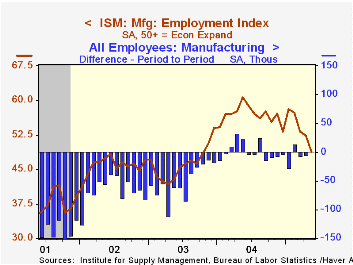
The production index (54.9) fell to its lowest since June 2003 and the pace of vendor deliveries sped up to the quickest in nearly two years.
The prices paid index fell sharply to the lowest since October 2003. During the last twenty years there has been an 81% correlation between vendor delivery speed and prices.
| ISM Manufacturing Survey | May | April | May '04 | 2004 | 2003 | 2002 |
|---|---|---|---|---|---|---|
| Composite Index | 51.4 | 53.3 | 62.6 | 60.5 | 53.3 | 52.4 |
| New Orders Index | 51.7 | 53.7 | 63.9 | 63.5 | 57.9 | 56.5 |
| Prices Paid Index (NSA) | 58.0 | 71.0 | 86.0 | 79.8 | 59.6 | 57.6 |
by Tom Moeller June 1, 2005
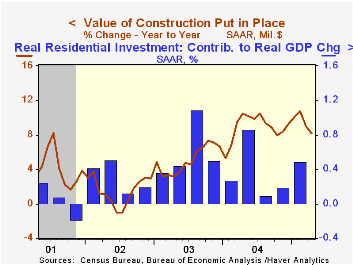
The total value of construction put in place rose another 0.5% in April and about matched Consensus expectations for a 0.7% gain.
Private residential building activity rose 0.6% for the second month but the value of new single family building declined 0.1% (+11.1% y/y), the first sequential decline since September. Building on new multi-family units jumped 1.4% (16.5% y/y).
Nonresidential building surged 1.3% led higher by a 1.8% (3.0% y/y) advance in office building. Manufacturing building also rose a strong 1.3% (38.7% y/y) but spending on power facilities fell 3.5% (-5.3% y/y).
Public construction fell as spending on highways & streets, nearly one third of the value of public construction spending, dropped for the second consecutive month (-3.7% y/y).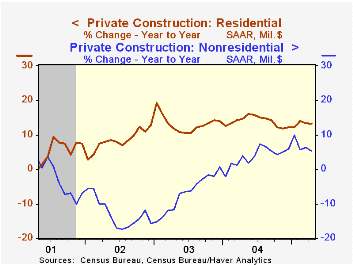
These more detailed categories represent the Census Bureau’s reclassification of construction activity into end-use groups. Finer detail is available for many of the categories; for instance, commercial construction is shown for Automotive sales and parking facilities, drugstores, building supply stores, and both commercial warehouses and mini-storage facilities. Note that start dates vary for some seasonally adjusted line items in 2000 and 2002 and that constant-dollar data are no longer computed.
| Construction Put-in-place | April | March | Y/Y | 2004 | 2003 | 2002 |
|---|---|---|---|---|---|---|
| Total | 0.5% | 0.6% | 8.2% | 8.9% | 5.1% | 1.5% |
| Private | 0.8% | 0.7% | 10.9% | 10.7% | 6.0% | -0.2% |
| Residential | 0.6% | 0.6% | 13.3% | 13.9% | 13.1% | 8.4% |
| Nonresidential | 1.3% | 1.0% | 5.3% | 3.7% | -7.1% | -12.8% |
| Public | -0.4% | 0.4% | -0.4% | 3.3% | 2.6% | 7.0% |
by Tom Moeller June 1, 2005
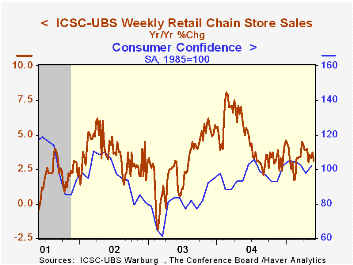
After a reasonable start in May, chain store sales subsequently fell during the last three weeks according to the International Council of Shopping Centers (ICSC)-UBS survey. Sales fell 1.0% last week and pulled the May average just 0.3% above April, half the gain during that month.
During the last ten years there has been a 56% correlation between the y/y change in chain store sales and the change in non-auto retail sales less gasoline, as published by the US Census Department. Chain store sales correspond directly with roughly 14% of non-auto retail sales less gasoline.
The leading indicator of chain store sales from ICSC did rise 0.2% w/w (0.5% y/y) pulling the monthly average up 0.4% versus April, the first monthly increase since February.
The ICSC-UBS retail chain-store sales index is constructed using the same-store sales (stores open for one year) reported by 78 stores of seven retailers: Dayton Hudson, Federated, Kmart, May, J.C. Penney, Sears and Wal-Mart.
| ICSC-UBS (SA, 1977=100) | 05/28/05 | 05/21/05 | Y/Y | 2004 | 2003 | 2002 |
|---|---|---|---|---|---|---|
| Total Weekly Chain Store Sales | 451.2 | 455.9 | 3.1% | 4.6% | 2.9% | 3.6% |
by Tom Moeller June 1, 2005
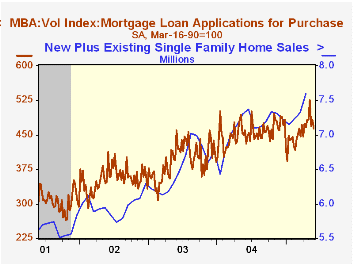
Total mortgage applications last week gave back more than half of the prior week's bounce and fell 2.8%. Applications so far in May are 6.5% ahead of April, according to the Mortgage Bankers Association.
Purchase applications dropped 4.1% but in May still are 3.1% ahead of April. During the last ten years there has been a 50% correlation between the y/y change in purchase applications and the change in new plus existing single family home sales.
Applications to refinance fell 1.2% yet in May are 11.2% higher than in April.
The effective interest rate on a conventional 30-year mortgage fell to 5.83% from 5.88% the week prior. The effective rate on a 15-year mortgage fell to 5.42%.
The Mortgage Bankers Association surveys between 20 to 35 of the top lenders in the U.S. housing industry to derive its refinance, purchase and market indexes. The weekly survey accounts for more than 40% of all applications processed each week by mortgage lenders. Visit the Mortgage Bankers Association site here.
| MBA Mortgage Applications (3/16/90=100) | 05/27/05 | 05/20/05 | Y/Y | 2004 | 2003 | 2002 |
|---|---|---|---|---|---|---|
| Total Market Index | 709.1 | 729.6 | 13.5% | 735.1 | 1,067.9 | 799.7 |
| Purchase | 462.7 | 482.3 | 0.6% | 454.5 | 395.1 | 354.7 |
| Refinancing | 2,142.1 | 2,167.9 | 35.3% | 2,366.8 | 4,981.8 | 3,388.0 |
by Carol Stone June 1, 2005
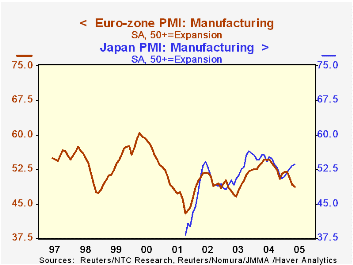
Manufacturing activity in Europe is decreasing. The widely followed "PMI" surveys, compiled by NTC Research in London and published by Reuters, indicate net decreases in overall manufacturing in the Euro-Zone for May, the second consecutive month. The total index is 48.70, off from 49.19 in April. All the major component countries registered readings below 50 as well. In fact, only the Czech Republic is holding onto growth, and at 51.39, that is slowing. Readings above 50 indicate net gains in business, while below 50 show a net contraction.
Yesterday in this space, Louise Curley described weakness in business and consumer confidence in Europe, and of course, French voters surprised their own government and Euro-Zone officials by soundly rejecting the European Union constitution, surely a manifestation of this lack of overall "confidence" in the region. Today's manufacturing data underscore some fundamental sources for that malaise.
Among the components of the PMI survey, new orders are below 50 for a second month and order backlogs are down for a third successive month. May is the first month that total output has fallen below the 50% breakeven level.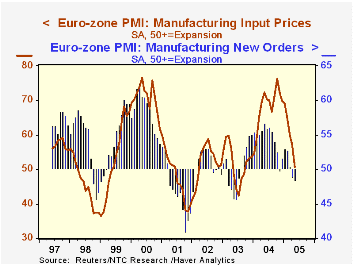
There is one notable sign of hope in these data. Input prices have been very strong in recent months, reaching a high of 76.7% last October. But the upward pressure on these costs has been dissipating, and in May nearly disappeared altogether. The input price index was 50.73 for the Euro-Zone, the lowest since September 2003. We'd surmise that the recent moderation in energy markets has contributed to this, and other commodity price movements have tempered as well.
In contrast, as we illustrate in the table below, manufacturing in two Asian economies is still growing. In Japan, a modest rise in the PMI index in May extends an uptrend to a fifth month. The China PMI eased from 54.36 to 53.27, but those followed a spurt in March to over 55; the Chinese series remain inconclusive at this time though, because there is only 13 months' worth of data.
| PMI for Manufacturing | May 2005 | April 2005 |
|---|---|---|
| Euro-Zone | 48.70 | 49.19 |
| Germany | 49.44 | 49.73 |
| France | 48.76 | 49.80 |
| Italy | 47.12 | 47.98 |
| Japan | 53.53 | 53.32 |
| China | 53.27 | 54.36 |

Tom Moeller
AuthorMore in Author Profile »Prior to joining Haver Analytics in 2000, Mr. Moeller worked as the Economist at Chancellor Capital Management from 1985 to 1999. There, he developed comprehensive economic forecasts and interpreted economic data for equity and fixed income portfolio managers. Also at Chancellor, Mr. Moeller worked as an equity analyst and was responsible for researching and rating companies in the economically sensitive automobile and housing industries for investment in Chancellor’s equity portfolio. Prior to joining Chancellor, Mr. Moeller was an Economist at Citibank from 1979 to 1984. He also analyzed pricing behavior in the metals industry for the Council on Wage and Price Stability in Washington, D.C. In 1999, Mr. Moeller received the award for most accurate forecast from the Forecasters' Club of New York. From 1990 to 1992 he was President of the New York Association for Business Economists. Mr. Moeller earned an M.B.A. in Finance from Fordham University, where he graduated in 1987. He holds a Bachelor of Arts in Economics from George Washington University.
More Economy in Brief


