 Global| Oct 01 2003
ISM Factory Index Down Just A Bit, Orders Rose
by:Tom Moeller
|in:Economy in Brief
Summary
The Purchasing Managers Composite Index (PMI) released by the Institute of Supply Management fell in September to 53.7 from 54.7 in August. Before yesterday's release of the weak Chicago PMI report, Consensus expectations were for a [...]
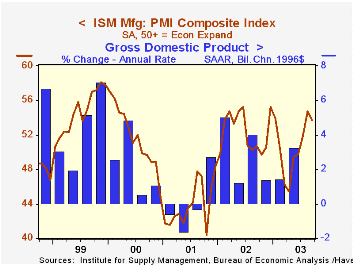
The Purchasing Managers’ Composite Index (PMI) released by the Institute of Supply Management fell in September to 53.7 from 54.7 in August. Before yesterday's release of the weak Chicago PMI report, Consensus expectations were for a reading of 55.0.
During the last twenty years there has been a 64% correlation between the National PMI index and quarterly growth in real GDP. That's slightly higher than the 57% correlation using the Chicago PMI.
The index for new orders rose slightly to the highest this year. Production retraced about half of its August jump but remained at the second highest level this year.
The employment index fell slightly m/m to 45.7, up from the recent lows near 42 but down from the 2002 highs of 48-49. This index has not been above 50, the dividing line between rising and falling activity, since September 2000. There has been a 68% correlation during the last ten years between the ISM employment index and the one-month change in factory sector payrolls.
The inventory index was up very slightly m/m to 42.7, the low end of a range in place since Spring 2002.
The prices paid index rose last month to 56.0. The price index has improved from the deflationary levels of late-2001 but it's current level does not suggest much pending inflationary pressure.
| ISM Manufacturing Survey | Sept | Aug | Sept '02 | 2002 | 2001 | 2000 |
|---|---|---|---|---|---|---|
| Composite Index | 53.7 | 54.7 | 50.7 | 52.4 | 44.0 | 51.7 |
| New Orders Index | 60.4 | 59.6 | 52.8 | 56.7 | 46.2 | 52.0 |
| Prices Paid Index (NSA) | 56.0 | 53.0 | 65.0 | 57.6 | 42.9 | 64.8 |
by Tom Moeller October 1, 2003
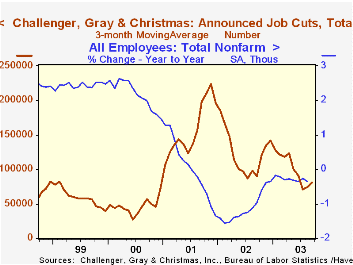
According to Challenger, Gray & Christmas, announced job cuts fell 4.3% last month versus August. Layoff announcements were up moderately versus a very depressed level last September.
The three month moving average of job cut announcements ticked up but was down by one-third from last year's average.
Job cut announcements differ from layoffs in that many are achieved through attrition or just never occur.
Regardless, during the last ten years there has been an 83% (inverse) correlation between the three month average level of announced job cuts and the y/y percent change payroll employment.
Job cut announcements were mixed m/m across industries but a 14,531 rise in industrial goods industries was notable..
| Challenger, Gray & Christmas | Sept | Aug | Y/Y | 2002 | 2001 |
|---|---|---|---|---|---|
| Announced Job Cuts | 76,506 | 79,925 | 9.2% | 1,431,052 | 1,956,876 |
by Tom Moeller October 1, 2003
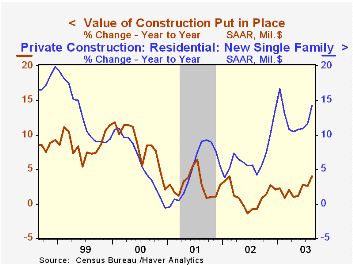
The value of total construction put in place rose the same 0.2% in August as it did in July. A 0.4% gain had been expected by the Consensus.
Private residential building activity showed some life, rising 1.4%. The gain was led by a 1.9% (14.2% y/y) surge in activity building single family homes.
Nonresidential building activity fell 2.7% (-1.2% y/y) as office building activity fell for the seventh month this year (-16.0% y/y). Commercial construction rose for the sixth month this year (+5.8% y/y).
Public sector building reversed the 0.6% decline of the prior month.
These more detailed categories represent the Census Bureau’s reclassification of construction activity into end-use groups. Finer detail is available for many of the categories; for instance, commercial construction is shown for Automotive sales and parking facilities, drugstores, building supply stores, and both commercial warehouses and mini-storage facilities. Note that start dates vary for some seasonally adjusted line items in 2000 and 2002 and that constant-dollar data are no longer computed.
| Construction Put-in-place | Aug | July | Y/Y | 2002 | 2001 | 2000 |
|---|---|---|---|---|---|---|
| Total | 0.2% | 0.2% | 4.0% | 1.1% | 2.7% | 8.3% |
| Private | 0.1% | 0.5% | 4.3% | -0.2% | 1.4% | 8.0% |
| Residential | 1.4% | 0.6% | 7.0% | 8.6% | 3.3% | 7.4% |
| Public | 0.6% | -0.6% | 3.2% | 5.3% | 7.4% | 9.5% |
by Tom Moeller October 1, 2003
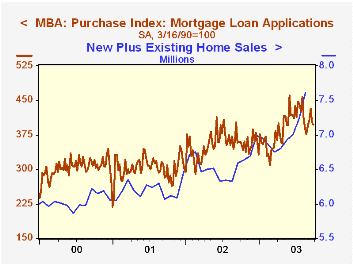
The index of mortgage applications compiled by the Mortgage Bankers Association rose 1.1% last week. Nevertheless, the average level of applications in September fell 4.7% versus August and the average was down 55.8% from the June high.
Applications for mortgages to purchase fell 1.1% for the second weekly drop. So far in September purchase applications are 1.2% ahead of the August average but they are down 5.2% from the July high.
The level of purchase applications in September is up 11.0% from a year ago. During the last ten years there has been a 55% correlation between the y/y change in purchase applications and the change in new plus existing home sales.
Applications to refinance rose 3.2% w/w. The average in September is down 70.7% from the June high. The percent of dollar volume of refinancing loans was 48.2% last week versus a Summer high of 80%.
Interest rates on a conventional 30-Year mortgage fell for the fourth consecutive week to 5.92% versus a recent high of 6.64% in early August. The effective rate on a 15-year mortgage fell to 5.28%, down from a high of 6.07%.
The Mortgage Bankers Association surveys between 20 to 35 of the top lenders in the U.S. housing industry to derive its refinance, purchase and market indexes. The weekly survey accounts for more than 40% of all applications processed each week by mortgage lenders. Visit the Mortgage Bankers Association site here.
| MBA Mortgage Applications (3/16/90=100) | 9/26/03 | 9/19/03 | 2002 | 2001 | 2000 |
|---|---|---|---|---|---|
| Total Market Index | 707.2 | 699.6 | 799.7 | 625.6 | 322.7 |
| Purchase | 397.8 | 402.1 | 354.7 | 304.9 | 302.7 |
| Refinancing | 2,506.8 | 2,429.7 | 3,388.0 | 2,491.0 | 438.8 |

Tom Moeller
AuthorMore in Author Profile »Prior to joining Haver Analytics in 2000, Mr. Moeller worked as the Economist at Chancellor Capital Management from 1985 to 1999. There, he developed comprehensive economic forecasts and interpreted economic data for equity and fixed income portfolio managers. Also at Chancellor, Mr. Moeller worked as an equity analyst and was responsible for researching and rating companies in the economically sensitive automobile and housing industries for investment in Chancellor’s equity portfolio. Prior to joining Chancellor, Mr. Moeller was an Economist at Citibank from 1979 to 1984. He also analyzed pricing behavior in the metals industry for the Council on Wage and Price Stability in Washington, D.C. In 1999, Mr. Moeller received the award for most accurate forecast from the Forecasters' Club of New York. From 1990 to 1992 he was President of the New York Association for Business Economists. Mr. Moeller earned an M.B.A. in Finance from Fordham University, where he graduated in 1987. He holds a Bachelor of Arts in Economics from George Washington University.
More Economy in Brief


