 Global| Dec 01 2009
ISM Factory Index Disappoints As Inventory Rebuilding Lags
by:Tom Moeller
|in:Economy in Brief
Summary
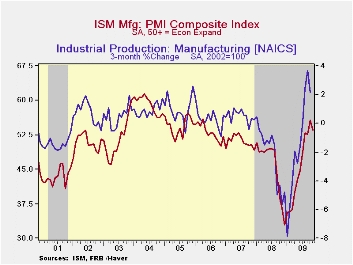
The pace of this economic recovery has lagged of late as the strength of inventory rebuilding has disappointed. The National Association of Purchasing Management reported that the November composite index unexpectedly slipped to 53.6 [...]
 The pace of
this economic recovery has lagged of late as the strength of inventory
rebuilding has disappointed. The National Association of Purchasing
Management reported that the November composite index unexpectedly
slipped to 53.6 from 55.7 during October. A more modest decline to 54.7
had been the Consensus expectation. (Any reading above the break-even
point of 50 suggests rising activity .) Despite the November decline,
the reading was up from the low of 32.9 reached last December. The ISM
data is available in Haver's USECON database.
The pace of
this economic recovery has lagged of late as the strength of inventory
rebuilding has disappointed. The National Association of Purchasing
Management reported that the November composite index unexpectedly
slipped to 53.6 from 55.7 during October. A more modest decline to 54.7
had been the Consensus expectation. (Any reading above the break-even
point of 50 suggests rising activity .) Despite the November decline,
the reading was up from the low of 32.9 reached last December. The ISM
data is available in Haver's USECON database.
 While just
above the break-even level of 50, the positive
factory-sector growth rate suggested by the ISM index is in-line with
recoveries accompanying past upturns from severe recessions. To mirror
the strength of those recoveries, however, the index still needs to
rise to a level near or above the level of 60.
While just
above the break-even level of 50, the positive
factory-sector growth rate suggested by the ISM index is in-line with
recoveries accompanying past upturns from severe recessions. To mirror
the strength of those recoveries, however, the index still needs to
rise to a level near or above the level of 60.
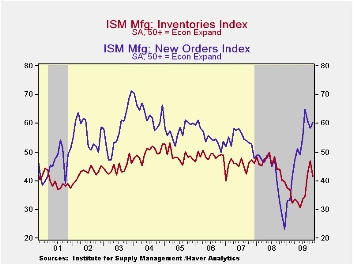
Holding back any improvement in the total index was a decline in the inventory component to 41.3 from 46.9 in October. The latest was the lowest level since August. An increased 19% (NSA) of respondents indicated that they were raising inventory levels versus 16% last November. However, during the strong 2005 inventory accumulation 26% of firms indicated that they were raising inventories.
A decline in the production component to 59.9 from the cycle high of 63.3 also was part of the decline in the November composite index. During the last ten years there has been an 84% correlation between the level of the production component of the composite index and the three-month growth in factory sector industrial production. It is appropriate to correlate the ISM index level with factory sector output growth because the ISM index is a diffusion index. It measures growth by using all of the positive changes in activity added to one half of the zero change in activity measures. The pace of supplier deliveries sped up last month with the easing of production.
Finally, the employment index fell to 50.8 from 53.1 during October. Still, the level indicated positive growth in factory-sector payrolls. It has increased from a low reading of 26.1 this past February. Twenty percent of respondents indicated higher payrolls versus only seven percent last November. Just sixteen percent indicated a lower level of hiring versus forty percent last November. During the last ten years there has been a 90% correlation between the index level and the three-month change in manufacturing payrolls.
 The new
orders index was the only component
series to improve m/m during November. The modest gain to 60.3,
however, left it below the August high. Working the other way, the
export order index improved modestly m/m to 56.0 which was the highest
level since August of last year and up from 35.5 last December. During
the last ten years there has been a 53% correlation between the index
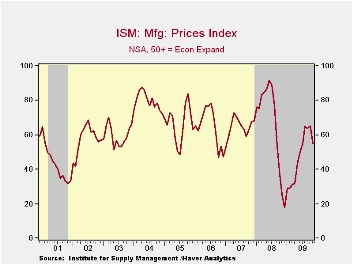
and the q/q change in real exports of goods in the GDP accounts.· The
separate index of prices paid fell ten points to its lowest level since
July. Still, the figure was up from the December low of 18.0. During
the last twenty years there has been a 79% correlation between the
price index and the three-month change in the PPI for intermediate
goods.
The new
orders index was the only component
series to improve m/m during November. The modest gain to 60.3,
however, left it below the August high. Working the other way, the
export order index improved modestly m/m to 56.0 which was the highest
level since August of last year and up from 35.5 last December. During
the last ten years there has been a 53% correlation between the index
and the q/q change in real exports of goods in the GDP accounts.· The
separate index of prices paid fell ten points to its lowest level since
July. Still, the figure was up from the December low of 18.0. During
the last twenty years there has been a 79% correlation between the
price index and the three-month change in the PPI for intermediate
goods.
The ISM data are available in Haver's USECON database.
Do Alternative Measures of GDP Affect Its Interpretation? from the Federal Reserve Bank of New York can be found here .
| ISM Mfg | November | October | September | November '08 | 2008 | 2007 | 2006 |
|---|---|---|---|---|---|---|---|
| Composite Index | 53.6 | 55.7 | 52.6 | 36.6 | 45.5 | 51.1 | 53.1 |
| New Orders | 60.3 | 58.5 | 60.8 | 28.1 | 42.1 | 54.3 | 55.4 |
| Employment | 50.8 | 53.1 | 46.2 | 34.3 | 43.2 | 50.5 | 51.7 |
| Production | 59.9 | 63.3 | 55.7 | 32.0 | 45.2 | 54.1 | 55.6 |
| Supplier Deliveries | 55.7 | 56.9 | 58.0 | 48.6 | 51.6 | 51.2 | 54.3 |
| Inventories | 41.3 | 46.9 | 42.5 | 40.1 | 45.5 | 45.4 | 48.8 |
| Prices Paid Index (NSA) | 55.0 | 65.0 | 63.5 | 25.5 | 66.5 | 64.6 | 65.0 |

Tom Moeller
AuthorMore in Author Profile »Prior to joining Haver Analytics in 2000, Mr. Moeller worked as the Economist at Chancellor Capital Management from 1985 to 1999. There, he developed comprehensive economic forecasts and interpreted economic data for equity and fixed income portfolio managers. Also at Chancellor, Mr. Moeller worked as an equity analyst and was responsible for researching and rating companies in the economically sensitive automobile and housing industries for investment in Chancellor’s equity portfolio. Prior to joining Chancellor, Mr. Moeller was an Economist at Citibank from 1979 to 1984. He also analyzed pricing behavior in the metals industry for the Council on Wage and Price Stability in Washington, D.C. In 1999, Mr. Moeller received the award for most accurate forecast from the Forecasters' Club of New York. From 1990 to 1992 he was President of the New York Association for Business Economists. Mr. Moeller earned an M.B.A. in Finance from Fordham University, where he graduated in 1987. He holds a Bachelor of Arts in Economics from George Washington University.
More Economy in Brief


