 Global| Dec 01 2009
ISM Factory Index Disappoints As Inventory Rebuilding Lags
by:Tom Moeller
|in:Economy in Brief
Summary
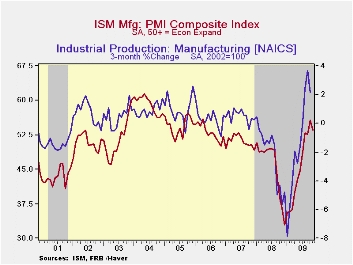
The pace of this economic recovery has lagged of late as the strength of inventory rebuilding has disappointed. The National Association of Purchasing Management reported that the November composite index unexpectedly slipped to 53.6 [...]
 The pace of
this economic recovery has lagged of late as the strength of inventory
rebuilding has disappointed. The National Association of Purchasing
Management reported that the November composite index unexpectedly
slipped to 53.6 from 55.7 during October. A more modest decline to 54.7
had been the Consensus expectation. (Any reading above the break-even
point of 50 suggests rising activity .) Despite the November decline,
the reading was up from the low of 32.9 reached last December. The ISM
data is available in Haver's USECON database.
The pace of
this economic recovery has lagged of late as the strength of inventory
rebuilding has disappointed. The National Association of Purchasing
Management reported that the November composite index unexpectedly
slipped to 53.6 from 55.7 during October. A more modest decline to 54.7
had been the Consensus expectation. (Any reading above the break-even
point of 50 suggests rising activity .) Despite the November decline,
the reading was up from the low of 32.9 reached last December. The ISM
data is available in Haver's USECON database.
 While just
above the break-even level of 50, the positive
factory-sector growth rate suggested by the ISM index is in-line with
recoveries accompanying past upturns from severe recessions. To mirror
the strength of those recoveries, however, the index still needs to
rise to a level near or above the level of 60.
While just
above the break-even level of 50, the positive
factory-sector growth rate suggested by the ISM index is in-line with
recoveries accompanying past upturns from severe recessions. To mirror
the strength of those recoveries, however, the index still needs to
rise to a level near or above the level of 60.
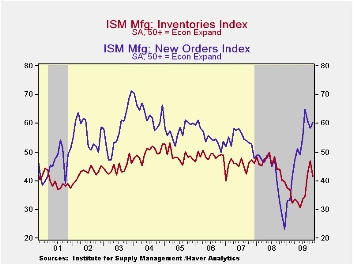
Holding back any improvement in the total index was a decline in the inventory component to 41.3 from 46.9 in October. The latest was the lowest level since August. An increased 19% (NSA) of respondents indicated that they were raising inventory levels versus 16% last November. However, during the strong 2005 inventory accumulation 26% of firms indicated that they were raising inventories.
A decline in the production component to 59.9 from the cycle high of 63.3 also was part of the decline in the November composite index. During the last ten years there has been an 84% correlation between the level of the production component of the composite index and the three-month growth in factory sector industrial production. It is appropriate to correlate the ISM index level with factory sector output growth because the ISM index is a diffusion index. It measures growth by using all of the positive changes in activity added to one half of the zero change in activity measures. The pace of supplier deliveries sped up last month with the easing of production.
Finally, the employment index fell to 50.8 from 53.1 during October. Still, the level indicated positive growth in factory-sector payrolls. It has increased from a low reading of 26.1 this past February. Twenty percent of respondents indicated higher payrolls versus only seven percent last November. Just sixteen percent indicated a lower level of hiring versus forty percent last November. During the last ten years there has been a 90% correlation between the index level and the three-month change in manufacturing payrolls.
 The new
orders index was the only component
series to improve m/m during November. The modest gain to 60.3,
however, left it below the August high. Working the other way, the
export order index improved modestly m/m to 56.0 which was the highest
level since August of last year and up from 35.5 last December. During
the last ten years there has been a 53% correlation between the index
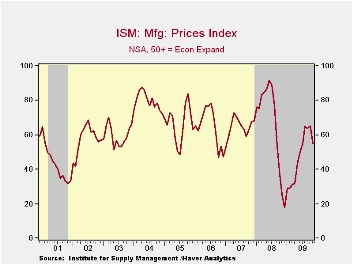
and the q/q change in real exports of goods in the GDP accounts.· The
separate index of prices paid fell ten points to its lowest level since
July. Still, the figure was up from the December low of 18.0. During
the last twenty years there has been a 79% correlation between the
price index and the three-month change in the PPI for intermediate
goods.
The new
orders index was the only component
series to improve m/m during November. The modest gain to 60.3,
however, left it below the August high. Working the other way, the
export order index improved modestly m/m to 56.0 which was the highest
level since August of last year and up from 35.5 last December. During
the last ten years there has been a 53% correlation between the index
and the q/q change in real exports of goods in the GDP accounts.· The
separate index of prices paid fell ten points to its lowest level since
July. Still, the figure was up from the December low of 18.0. During
the last twenty years there has been a 79% correlation between the
price index and the three-month change in the PPI for intermediate
goods.
The ISM data are available in Haver's USECON database.
Do Alternative Measures of GDP Affect Its Interpretation? from the Federal Reserve Bank of New York can be found here .
| ISM Mfg | November | October | September | November '08 | 2008 | 2007 | 2006 |
|---|---|---|---|---|---|---|---|
| Composite Index | 53.6 | 55.7 | 52.6 | 36.6 | 45.5 | 51.1 | 53.1 |
| New Orders | 60.3 | 58.5 | 60.8 | 28.1 | 42.1 | 54.3 | 55.4 |
| Employment | 50.8 | 53.1 | 46.2 | 34.3 | 43.2 | 50.5 | 51.7 |
| Production | 59.9 | 63.3 | 55.7 | 32.0 | 45.2 | 54.1 | 55.6 |
| Supplier Deliveries | 55.7 | 56.9 | 58.0 | 48.6 | 51.6 | 51.2 | 54.3 |
| Inventories | 41.3 | 46.9 | 42.5 | 40.1 | 45.5 | 45.4 | 48.8 |
| Prices Paid Index (NSA) | 55.0 | 65.0 | 63.5 | 25.5 | 66.5 | 64.6 | 65.0 |
Weekly Gasoline Prices Are Flat Again
by Tom Moeller December 1, 2009
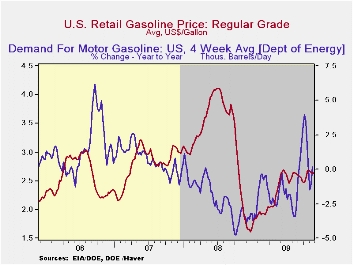 Gasoline
prices continued their sideways movement last week. The pump
price for regular gasoline of $2.63 per gallon equaled the
June average. Moreover, during the six months, prices moved in a tight
range between $2.47 and $2.69. Nevertheless, gasoline prices remain up
from the December low of $1.61. Yesterday, wholesale gasoline prices
began the week roughly equal to last week's average. The figures are
reported by the U.S. Department of Energy and can be found in Haver's WEEKLY
& DAILY databases.
Gasoline
prices continued their sideways movement last week. The pump
price for regular gasoline of $2.63 per gallon equaled the
June average. Moreover, during the six months, prices moved in a tight
range between $2.47 and $2.69. Nevertheless, gasoline prices remain up
from the December low of $1.61. Yesterday, wholesale gasoline prices
began the week roughly equal to last week's average. The figures are
reported by the U.S. Department of Energy and can be found in Haver's WEEKLY
& DAILY databases.
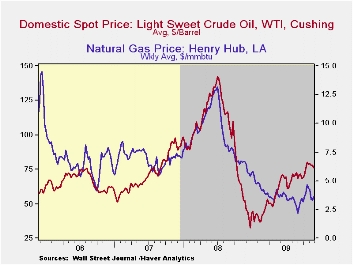
Breaking away from the recently firm pricing pattern, the price for a barrel of light sweet crude (WTI) oil moved down last week to $76.10 which was the lowest level in one month. Still, prices were up from the December low of $32.37. Yesterday, the spot market price for light sweet crude oil moved slightly higher to $77.28 per barrel.
 Behind the
stabilization in
gasoline prices is a leveling of past gains in gasoline demand. Last
week, demand posted a 0.2% increase versus one year ago versus a 3.9%
increase at the beginning of last month. Breaking away from earlier y/y
strength, the demand for residual fuel oil fell 0.4% y/y while
distillate demand continued weak and fell 10.7% y/y.· Natural gas
prices remained weak last week at an average $3.62 per mmbtu (-45.7%
y/y). They remained down by two-thirds from the high reached in
early-July of last year of $13.19/mmbtu.
Behind the
stabilization in
gasoline prices is a leveling of past gains in gasoline demand. Last
week, demand posted a 0.2% increase versus one year ago versus a 3.9%
increase at the beginning of last month. Breaking away from earlier y/y
strength, the demand for residual fuel oil fell 0.4% y/y while
distillate demand continued weak and fell 10.7% y/y.· Natural gas
prices remained weak last week at an average $3.62 per mmbtu (-45.7%
y/y). They remained down by two-thirds from the high reached in
early-July of last year of $13.19/mmbtu.
The weekly energy price data can be found in Haver's WEEKLY database while the daily figures are in DAILY. The gasoline demand figures are in OILWKLY.
Small business lending is yesterday's House testimony by Jon D. Greenlee, Associate Director, Division of Banking Supervision and Regulation at the Federal Reserve Board and it can be found here.
| Weekly Prices | 11/30/09 | 11/23/09 | 11/16/09 | Y/Y | 2008 | 2007 | 2006 |
|---|---|---|---|---|---|---|---|
| Retail Regular Gasoline ($ per Gallon, Regular) | 2.63 | 2.64 | 2.63 | 45.2% | 3.25 | 2.80 | 2.57 |
| Light Sweet Crude Oil, WTI ($ per bbl.) | 76.10 | 78.36 | 78.21 | 45.0% | 100.16 | 72.25 | 66.12 |
German Retail Sales Rise But Amass No Momentum
by Robert Brusca December 1, 2009
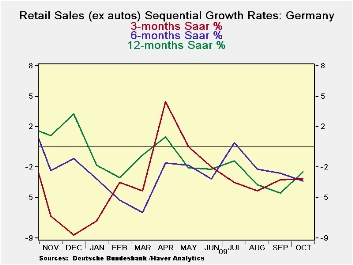
German retail sales rose in October, reversing a drop in September, but sales continue to show negative momentum. The sequential nominal rates of growth from 12-months to 6-months to 3-months all are clustered around a minus 3% growth rate. For real retail sales the sequential growth rates show a move to more weakness despite the bump up in sales in October. Real retail sales sequential growth rates are getting to be more severe negative numbers.
Only clothing and footwear sales are showing any kind of strength. Footwear and clothing sales are now up Yr/Yr along with car registrations. Government programs have skewed spending toward car purchases by offering incentives. Clothing and footwear are just beginning to pick up. Still there is nothing upbeat about the German consumer in this report. The rise in spending in October sure beats a drop. But trends are not reversed or even blunted by this rise after two months of steep drops.
| German Real and Nominal Retail Sales | QTR | |||||||
|---|---|---|---|---|---|---|---|---|
| Nominal | Oct-09 | Sep-09 | Aug-09 | 3-MO | 6-MO | 12-MO | YrAgo | Saar |
| Retaill Ex auto | 0.6% | -0.5% | -0.9% | -3.2% | -3.3% | -2.5% | 2.0% | -0.2% |
| MV and Parts | 0.5% | -0.2% | -1.5% | -4.8% | -3.0% | -1.7% | 0.2% | -0.8% |
| Food Bev & Tobacco | -1.6% | -3.4% | 3.7% | -6.0% | -7.0% | -5.0% | 1.4% | -15.4% |
| Clothing footwear | 8.5% | 2.9% | -7.4% | 14.5% | 9.9% | 7.1% | 1.6% | 56.6% |
| Car Registrations (units) | -0.1% | -2.7% | -9.5% | -40.1% | -31.4% | 24.0% | -8.3% | 0.0% |
| Real | ||||||||
| Retail Ex auto | 0.5% | -0.2% | -1.5% | -4.8% | -3.0% | -1.7% | 0.2% | -0.8% |
German Unemployment Rate Declines
by Louise Curley December 1, 2009
 The
Bundesbank announced today that the Registered unemployment rate in
Germany declined in November to 8.1% from 8.2% in the preceding three
months. At the same time, Eurostat reported harmonized
unemployment rates for October. On that basis, the German
unemployment rate began to decline a month earlier, to 7.5% in October
from 7.6% in September. (Germany's national measure of
unemployment is typically greater than that of the harmonized measure
of Eurostat as can be seen in the first chart. Part of the
difference is due to the fact that the national measure includes only
registered workers while the Eurostat measure includes the whole labor
force. In addition there are differences in the unemployment
concept.)
The
Bundesbank announced today that the Registered unemployment rate in
Germany declined in November to 8.1% from 8.2% in the preceding three
months. At the same time, Eurostat reported harmonized
unemployment rates for October. On that basis, the German
unemployment rate began to decline a month earlier, to 7.5% in October
from 7.6% in September. (Germany's national measure of
unemployment is typically greater than that of the harmonized measure
of Eurostat as can be seen in the first chart. Part of the
difference is due to the fact that the national measure includes only
registered workers while the Eurostat measure includes the whole labor
force. In addition there are differences in the unemployment
concept.)
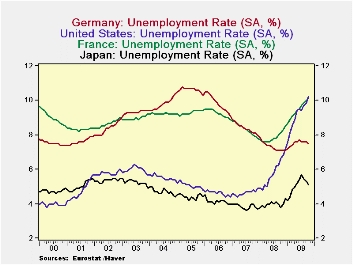
Except for Japan where the
unemployment rate declined to 5.1% in October from 5.3% in September,
most other industrial countries are still experiencing rises in
unemployment. In addition, the rise in the unemployment rate
in Germany during the recession was more muted than that in other
industrial countries--even Japan--as can be seen in the second
chart. (To insure comparability we have used harmonized
unemployment rates. These may be found in Haver's
EUROSTAT data base.)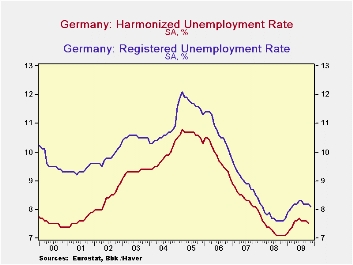
Germany's lower unemployment rate has been due largely to the "short-term work program" part of its stimulus program. To encourage companies to maintain employees when production falls off, the German government has set up a fund which can be drawn upon to help pay the wages of the employees who have been kept on. On November 25, the Cabinet agreed to extend the program for another year beginning in January.
| Nov 09 | Oct 09 | Sep 09 | Aug 09 | Jul 09 | Jun 09 | |
|---|---|---|---|---|---|---|
| Germany: Registered Unemployment Rate (%) | 8.1 | 8.2 | 8.2 | 8.2 | 8.3 | 8.3 |
| Harmonized Unemployment Rates (%) | ||||||
| Germany | - | 7.5 | 7.6 | 7.6 | 7.6 | 7.7 |
| Japan | - | 5.1 | 5.3 | 5.5 | 5.7 | 5.4 |
| France | - | 10.1 | 10.0 | 9.8 | 9.7 | 9.5 |
| United States | - | 10.2 | 9.8 | 9.7 | 9.4 | 9.5 |
U.S. Pending Home Sales Rise Further
by Tom Moeller December 1, 2009
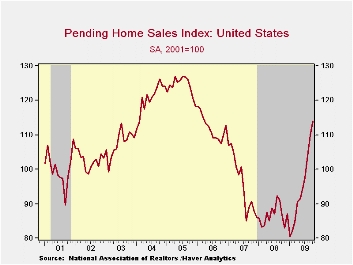 Home sales
continued to rebound in October, spurred by low interest rates and a
tax credit. The National Association of Realtors (NAR) reported that
October pending home sales increased 3.7%. It was the ninth consecutive
monthly gain and sales are up 41.9% from the low. Consensus
expectations had been for a slight m/m sales decline. The index level
of 114.1 was at its highest since March 2006. The base for the index is
2001=100.
Home sales
continued to rebound in October, spurred by low interest rates and a
tax credit. The National Association of Realtors (NAR) reported that
October pending home sales increased 3.7%. It was the ninth consecutive
monthly gain and sales are up 41.9% from the low. Consensus
expectations had been for a slight m/m sales decline. The index level
of 114.1 was at its highest since March 2006. The base for the index is
2001=100.
October sales likely were boosted by the pending expiration of an $8,000 first-time home buyers tax credit. The credit has since been extended into next year.
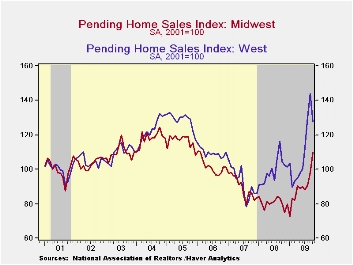
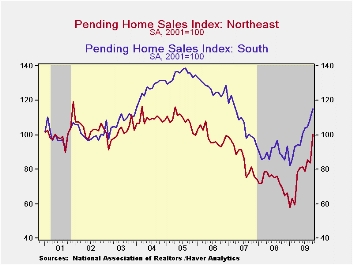 Only the
Western region
of the country failed to participate in the October sales gain. Sales
reversed the September increase but were still up by nearly one-quarter
from last year. Elsewhere, sales in the Northeast more-than made up a
September decline with a 19.9% jump. Sales in the Midwest rose 11.6% to
the highest level since early-2006. Sales in the South were the
laggards again with just a 5.4% gain but they also were up one-third
from the January trough.
Only the
Western region
of the country failed to participate in the October sales gain. Sales
reversed the September increase but were still up by nearly one-quarter
from last year. Elsewhere, sales in the Northeast more-than made up a
September decline with a 19.9% jump. Sales in the Midwest rose 11.6% to
the highest level since early-2006. Sales in the South were the
laggards again with just a 5.4% gain but they also were up one-third
from the January trough.
 These home
sales figures are analogous to
the new home sales data from the Commerce Department in that they
measure existing home sales when the sales contract is signed, not at
the time the sale is closed. The series dates back to
2001.
These home
sales figures are analogous to
the new home sales data from the Commerce Department in that they
measure existing home sales when the sales contract is signed, not at
the time the sale is closed. The series dates back to
2001.
The pending home sales data are available in Haver's PREALTOR database. The number of homes on the market and prices are in the REALTOR database.
How Rigid Are Producer Prices? from the Federal Reserve Bank of New York is available here.
| Pending Home Sales (2001=100) | October | September | August | Y/Y | 2008 | 2007 | 2006 |
|---|---|---|---|---|---|---|---|
| Total | 114.1 | 110.0 | 103.8 | 31.8% | 86.8 | 95.8 | 112.1 |
| Northeast | 100.2 | 83.6 | 85.3 | 44.2 | 73.1 | 85.9 | 98.9 |
| Midwest | 109.6 | 98.2 | 90.8 | 36.5 | 80.6 | 89.5 | 101.9 |
| South | 115.4 | 109.5 | 104.6 | 31.6 | 89.6 | 107.3 | 127.2 |
| West | 127.7 | 143.8 | 130.5 | 22.0 | 99.5 | 92.3 | 109.6 |

Tom Moeller
AuthorMore in Author Profile »Prior to joining Haver Analytics in 2000, Mr. Moeller worked as the Economist at Chancellor Capital Management from 1985 to 1999. There, he developed comprehensive economic forecasts and interpreted economic data for equity and fixed income portfolio managers. Also at Chancellor, Mr. Moeller worked as an equity analyst and was responsible for researching and rating companies in the economically sensitive automobile and housing industries for investment in Chancellor’s equity portfolio. Prior to joining Chancellor, Mr. Moeller was an Economist at Citibank from 1979 to 1984. He also analyzed pricing behavior in the metals industry for the Council on Wage and Price Stability in Washington, D.C. In 1999, Mr. Moeller received the award for most accurate forecast from the Forecasters' Club of New York. From 1990 to 1992 he was President of the New York Association for Business Economists. Mr. Moeller earned an M.B.A. in Finance from Fordham University, where he graduated in 1987. He holds a Bachelor of Arts in Economics from George Washington University.
More Economy in Brief


