 Global| Oct 12 2004
Investor Confidence in Germany Plunges: Does It Portend Worse to Come or Does It Reflect What Is Happening?
Summary
The ZEW index of sentiment among institutional investors and analysts declined 7.1 points from September to 31.3 in October and was 29 points below October of a year ago. It was also below its long term average of 34. There has been a [...]
The ZEW index of sentiment among institutional investors and analysts declined 7.1 points from September to 31.3 in October and was 29 points below October of a year ago. It was also below its long term average of 34.
There has been a lot of discouraging news out of Germany in recent months that is likely to have affected the responses of the 297 investors and analysts who participated in the survey. Listed below are some of the data that have recently been reported for the month of August. Industrial production, manufacturing sales and new orders and exports have all shown August declines. Retail sales on a seasonally adjusted basis rose by 1.2% in August over July, but they were only 0.20% above August 2003.
Underlying all these sluggish trends is, of course, the rise in the price of oil. In August, the average price of Brent Crude was $43.20 a barrel, 13.30% above the July figure and 45.41% above August of 2003. The price has continued to rise and is today over $50 a barrel.
Although confidence and sentiment indicators are considered to be leading indicators of future trends in the economy, it should be noted that past trends in the economy often play an important role in formulating the opinions of the participants of the surveys. It is when the confidence or sentiment indicator suggests a trend different from the past that it is most useful.
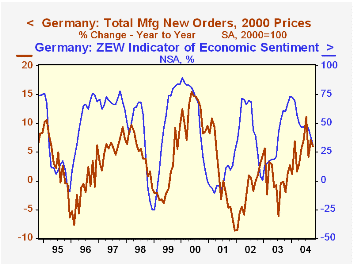
To illustrate the influence of economic news on the opinions of investors and analysts, the attached chart plots the year to year change in manufacturing new orders two months ahead with the actual month of the ZEW index. Any of the other measures shown in the table below would show similar comparisons with the ZEW index.
| Oct 04 | Sep 04 | Oct 03 | M/M Pt Ch | Y/Y Pt Ch | 2003 Pt Ch | 2002 Pt Ch | 2001 Pt Ch | |
|---|---|---|---|---|---|---|---|---|
| ZEW (% Balance of Positive vs. Negative) | 31.3 | 38.4 | 60.3 | -7.1 | -29.0 | -6.9 | 42.5 | -56.3 |
| Aug 04 | Jul 04 | Aug 03 | M/M % |
Y/Y % |
2003 % | 2002 % | 2001 % | |
| Industrial Production (2000=100) | 100.5 | 101.5 | 96.9 | -0.99 | 3.72 | 0.08 | -1.22 | -0.37 |
| Retail Sales (2000=100) | 99.1 | 98.1 | 98.9 | 1.02 | 0.20 | -0.18 | -1.58 | 1.94 |
| Manufacturing Sales (2000=100) | ||||||||
| Domestic | 95.2 | 101.2 | 86.4 | -5.93 | 10.19 | -0.77 | -3.30 | 0.68 |
| Foreign | 102.8 | 116.5 | 88.6 | -11.76 | 16.03 | 0.96 | 1.16 | 4.16 |
| Mfg New Orders (2000=100) | ||||||||
| Domestic | 97.5 | 98.5 | 91.8 | -1.02 | 9.21 | 0.01 | -3.08 | -2.29 |
| Foreign | 112.9 | 115.2 | 104.7 | -2.00 | 7.83 | 1.56 | 3.69 | -0.85 |
| Exports (Bil. Euros) | 60.86 | 91.75 | 55.8 | -1.44 | 9.05 | 1.92 | 2.85 | 7.42 |
| Oil Price-Brent Crude ($/bbl) | 43.20 | 38.10 | 29.71 | 13.30 | 45.41 | 15.72 | 1.80 | -13.91 |
More Economy in Brief


