 Global| Apr 03 2003
Initial Jobless Insurance Claims Surged
by:Tom Moeller
|in:Economy in Brief
Summary
Initial claims for unemployment insurance last week were much higher than Consensus expectations for 410,000. Claims in the prior week were revised up slightly. The 9.3% w/w rise to 445,000 brought claims to the highest level since [...]
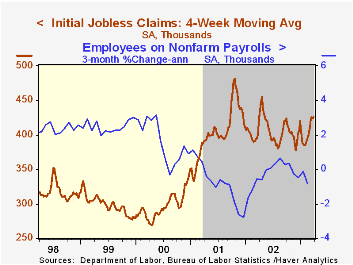
Initial claims for unemployment insurance last week were much higher than Consensus expectations for 410,000. Claims in the prior week were revised up slightly. The 9.3% w/w rise to 445,000 brought claims to the highest level since April 2002.
Initial claims have been above 400,000 for seven consecutive weeks.
The four-week moving average of initial claims rose to 426,250, up 0.6% y/y. During the last ten years there has been a 72% correlation (inverse) between the level of initial claims and the three month growth in nonfarm payrolls.
Continuing claims for unemployment insurance jumped 3.1% to the highest level since mid-November. During the last ten years there has been a 65% correlation (inverse) between the level of continued claims and the three month growth in nonfarm payrolls.
The insured rate of unemployment was unchanged from the prior week's level at 2.8% where it has been for three consecutive weeks.
| Unemployment Insurance (000s) | 3/29/03 | 3/22/03 | Y/Y | 2002 | 2001 | 2000 |
|---|---|---|---|---|---|---|
| Initial Claims | 445.0 | 407.0 | -9.6% | 405.0 | 405.8 | 299.8 |
| Continuing Claims | -- | 3,608 | -0.2% | 3,588 | 3,021 | 2,114 |
by Tom Moeller April 3, 2003
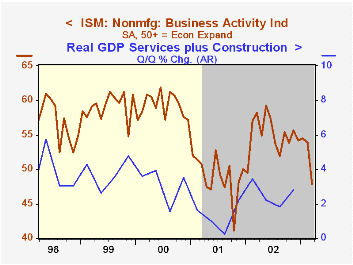
The Institute for Supply Management business activity index of the nonmanufacturing sector fell last month more than Consensus expectations for a decline to 52.0.
The 6 point decline to 47.9 was the steepest in one month since October 2001. It pulled the index level below 50 for the first time since January 2002.
During the last five years, there has been a 68% correlation between the level of the Business Activity Index from the ISM nonmanufacturing survey and quarterly growth in real GDP in the service sector plus structures.
The seasonally adjusted new orders index fell sharply to 47.7, the lowest level since November 2001.
The employment index also fell. At 47.9 it was the second month the index was below 50.
Business activity for the nonmanufacturing sector is a question separate from the subgroups mentioned above. In contrast, the NAPM manufacturing sector composite index weights the components.
The seasonally adjusted index of prices rose again to the highest level since December 2000.
ISM surveys more than 370 purchasing managers in more than 62 industries including construction, law firms, hospitals, government and retailers. The nonmanufacturing survey dates only to July 1997, therefore its seasonal adjustment should be viewed tentatively.
| ISM Nonmanufacturing Survey | Mar | Feb | Y/Y | 2002 | 2001 | 2000 |
|---|---|---|---|---|---|---|
| Business Activity Index | 47.9 | 53.9 | 58.2 | 55.1 | 49.0 | 59.3 |
| Prices Index | 62.0 | 60.9 | 51.4 | 53.9 | 51.6 | 63.5 |

Tom Moeller
AuthorMore in Author Profile »Prior to joining Haver Analytics in 2000, Mr. Moeller worked as the Economist at Chancellor Capital Management from 1985 to 1999. There, he developed comprehensive economic forecasts and interpreted economic data for equity and fixed income portfolio managers. Also at Chancellor, Mr. Moeller worked as an equity analyst and was responsible for researching and rating companies in the economically sensitive automobile and housing industries for investment in Chancellor’s equity portfolio. Prior to joining Chancellor, Mr. Moeller was an Economist at Citibank from 1979 to 1984. He also analyzed pricing behavior in the metals industry for the Council on Wage and Price Stability in Washington, D.C. In 1999, Mr. Moeller received the award for most accurate forecast from the Forecasters' Club of New York. From 1990 to 1992 he was President of the New York Association for Business Economists. Mr. Moeller earned an M.B.A. in Finance from Fordham University, where he graduated in 1987. He holds a Bachelor of Arts in Economics from George Washington University.


