 Global| Dec 19 2002
Initial Jobless Insurance Claims Remained High
by:Tom Moeller
|in:Economy in Brief
Summary
Initial claims for unemployment insurance fell less than expected last week from the elevated level of the week prior. Claims in the prior week were revised slightly higher. The latest figure is for the survey period for December [...]
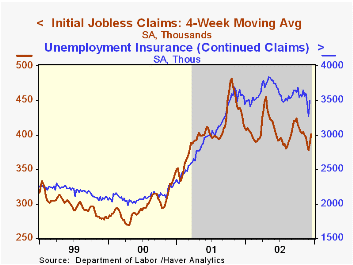
Initial claims for unemployment insurance fell less than expected last week from the elevated level of the week prior. Claims in the prior week were revised slightly higher.
The latest figure is for the survey period for December nonfarm payrolls. The sharp 13.4% rise in claims from the November survey period probably overstates the degree of recent weakening in the labor market.
The four-week moving average of initial claims rose to 400,750, down 6.2% y/y.
Continuing claims for unemployment insurance rose a sharp 7.0% w/w. That followed sharp declines in the prior two weeks. The level of claimants in the prior week was revised down.
The insured rate of unemployment rose back to 2.7% and remained down slightly from the average of the prior four months.
| Unemployment Insurance (000s) | 12/14/02 | 12/07/02 | Y/Y | 2001 | 2000 | 1999 |
|---|---|---|---|---|---|---|
| Initial Claims | 433.0 | 444.0 | 9.6% | 405.8 | 299.8 | 297.7 |
| Continuing Claims | -- | 3,497 | -2.1% | 3,021 | 2,114 | 2,186 |
by Tom Moeller December 19, 2002
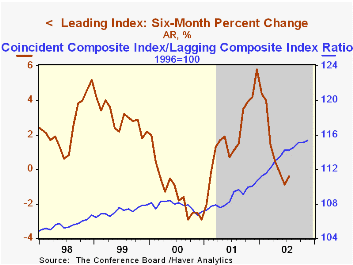
The Composite Index of Leading Economic Indicators, reported by the Conference Board, rose more than expected last month. The prior month's unchanged reading was revised up slightly.
The breadth-of-gain amongst the leaders' component series fell slightly to 55%, but the last two months represent marked improvement from 3Q.
Lower claims for jobless insurance, higher stock prices, a higher money supply, a steeper yield curve and higher consumer expectations had large, and roughly equal, positive influences on the leading index in November.
The ratio of coincident-to-lagging indicators rose after having been unchanged in October. The ratio is an indicator of excess relative to actual economic performance.
The coincident indicators have moved sideways since July.
The Leading index is based on eight previously reported economic data series and two that are estimated.
| Business Cycle Indicators | Nov | Oct | Y/Y | 2001 | 2000 | 1999 |
|---|---|---|---|---|---|---|
| Leading | 0.7% | 0.1% | 2.0% | -0.7% | 1.1% | 3.3% |
| Coincident | 0.1% | 0.0% | 0.9% | -0.5% | 3.4% | 3.2% |
| Lagging | -0.2% | 0.0% | -3.7% | -1.3% | 2.8% | 1.7% |
by Tom Moeller December 19, 2002
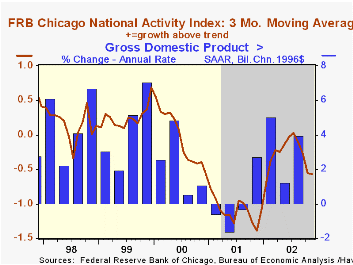
The Chicago Fed National Activity Index (CFNAI) improved last month and just reversed the decline of the prior month. Nevertheless, the latest level is just about equal to the depressed levels of this past Summer.
The improvement left the three-month moving average of the CFNAI at -0.57, a level consistent with roughly 2% growth in real GDP.. A zero value of the CFNAI indicates that the economy is expanding at its historical trend rate of growth.
During the last ten years there has been a 72% correlation between the level of the CFNAI and quarterly growth in real GDP.
The CFNAI is a weighted average of 85 indicators of economic activity. The indicators reflect activity in the following categories: production & income, the labor market, personal consumption & housing, mfg. & trade sales, and inventories & orders.
For a complete discussion of the Chicago Fed's National Activity Index click here.
A discussion of the CFNAI and its role as a business cycle indicator can be found here.
| Chicago Fed | Nov | Oct | Nov '01 | 2001 | 2000 | 1999 |
|---|---|---|---|---|---|---|
| CFNAI | -0.51 | -0.73 | -1.34 | -1.10 | -0.18 | 0.27 |
by Tom Moeller December 19, 2002
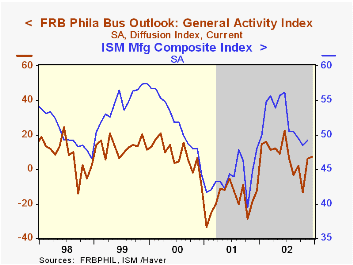
The Philadelphia Fed’s index of general business conditions rose last month, adding to the meaningful improvement of the prior month. The Business Activity Index rose to 7.2, the highest level since June. A reading of 5.0 had been expected.
The improvement mirrored the surprising, modest rise reported Monday in the Empire State General Conditions Index for December.
Amongst the sub indexes new orders, shipments and employment fell versus November. Inventories, unfilled orders and delivery lead times improved.
The business conditions index reflects a separate survey question, not the components.
The Philadelphia Fed index is based on a survey of 250 regional manufacturing firms, but these firms sell nationally and internationally.
During the last ten years there has been a 71% correlation between the level of the General Activity Index and the level of the ISM Composite Index.
For a discussion of the Philadelphia Fed's Business Outlook Survey click here.
| Philadelphia Fed Business Outlook | Dec | Nov | Y/Y | 2002 | 2001 | 2000 |
|---|---|---|---|---|---|---|
| General Activity Index | 7.2 | 6.1 | -12.6 | 7.6 | -17.3 | 8.2 |
| Prices Paid Index | 15.1 | 13.0 | -11.8 | 12.2 | -1.0 | 27.1 |
by Tom Moeller December 19, 2002
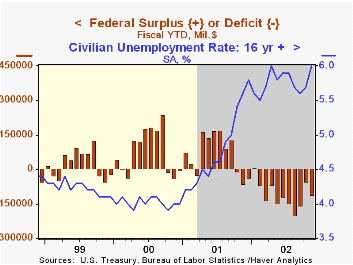
The US budget last month came in near Consensus expectations for a $60 bil. deficit. The Fiscal 2003 YTD deficit was $113.1B, nearly double the deficit in the first two months of Fiscal 2002.
Receipts fell 3.6% m/m following a sharp m/m decline in October. Calendar distortions probably aggravated the shortfall due to the weak economy. Individual tax payments fell 18.7% m/m and were down 8.6% in October and November versus last fiscal year to date. The gain in payroll taxes has slowed to a fraction of its 6.3% in FY 2001.
Federal expenditures rose slightly m/m following a surge in October. Fiscal YTD outlays were up 5.1% y/y. Defense spending was up 10.4% y/y. Spending on health (11.1%) and education (13.0%) programs continued strong.
For a discussion of the economic effects of long-term fiscal discipline by the Brookings Institution click here.
| US Government Finance | Nov | Oct | Y/Y | FY2002 | FY2001 | FY2000 |
|---|---|---|---|---|---|---|
| Budget Balance | $-59.1B | $-54.0B | $-54.3B | $-158.5B | $127.1B | $125.5B |
| Revenues | $120.0B | $124.6B | -1.0% | -6.9% | -1.7% | 10.8% |
| Outlays | $179.1B | $178.5B | 2.1% | 7.9% | 4.2% | 5.1% |

Tom Moeller
AuthorMore in Author Profile »Prior to joining Haver Analytics in 2000, Mr. Moeller worked as the Economist at Chancellor Capital Management from 1985 to 1999. There, he developed comprehensive economic forecasts and interpreted economic data for equity and fixed income portfolio managers. Also at Chancellor, Mr. Moeller worked as an equity analyst and was responsible for researching and rating companies in the economically sensitive automobile and housing industries for investment in Chancellor’s equity portfolio. Prior to joining Chancellor, Mr. Moeller was an Economist at Citibank from 1979 to 1984. He also analyzed pricing behavior in the metals industry for the Council on Wage and Price Stability in Washington, D.C. In 1999, Mr. Moeller received the award for most accurate forecast from the Forecasters' Club of New York. From 1990 to 1992 he was President of the New York Association for Business Economists. Mr. Moeller earned an M.B.A. in Finance from Fordham University, where he graduated in 1987. He holds a Bachelor of Arts in Economics from George Washington University.
More Economy in Brief


