 Global| Jul 31 2003
Initial Jobless Claims Below 400,000 a Second Week
Summary
Real GDP grew at a 2.4% annual rate in the second quarter, after increasing only 1.4% in each of the two previous periods. Consensus forecasts for 2Q GDP were 1.8% growth. Personal consumption expenditures were 3.3% (a.r.) higher than [...]
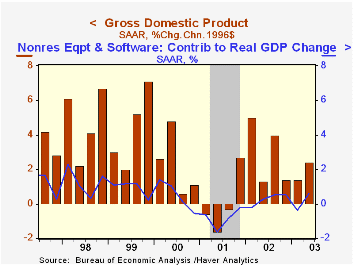
Real GDP grew at a 2.4% annual rate in the second quarter, after increasing only 1.4% in each of the two previous periods. Consensus forecasts for 2Q GDP were 1.8% growth.
Personal consumption expenditures were 3.3% (a.r.) higher than last quarter with the bulk of the advance in durable goods purchases (+22.6% a.r.). Fixed investment rose by 6.6% a.r. the largest increase since the second quarter of 2000. Expenditures for equipment and software (+4.8% a.r.) grew for the first time since the fourth quarter of 2000.
Federal defense spending soared by 44.1% a.r. in the second quarter, while federal nondefense and state and local government expenditures were lower.
The largest drag on second quarter GDP was the trade balance. Exports were 3.1% a.r. lower while imports increased by 9.2% a.r. causing a negative contribution of 1.56 percentage points to real GDP.
Domestic final demand was up 4.6% a.r. last quarter, the largest increase since the first quarter of 2000.
Inflation was up a modest 1.0 % with the price indexes of many consumer goods declining.
| Chained '96 $, % AR | 2Q'03 | 1Q'03 | 4Q'02 | 2002 | 2001 | 2000 |
|---|---|---|---|---|---|---|
| GDP | 2.4% | 1.4% | 1.4% | 2.4% | 0.3% | 3.8% |
| Inventory Effect | -0.8% | -0.8% | 0.3% | 0.6% | -1.2% | 0.1% |
| Final Sales | 3.2% | 2.3% | 1.1% | 1.8% | 1.5% | 3.7% |
| Trade Effect | -1.6% | 0.8% | -1.6% | -0.7% | -0.2% | -0.7% |
| Domestic Final Demand | 4.6% | 1.4% | 2.6% | 2.4% | 1.6% | 4.3% |
| Chained GDP Price Deflator | 1.0% | 2.4% | 1.8% | 1.1% | 2.4% | 2.1% |
by Carol Stone July 31, 2003
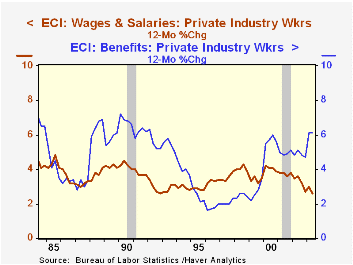
After increasing by 1.3% in the first quarter of 2003 the employment cost index for civilian workers advanced a more modest 0.9% in the second quarter.
The components for both wages and salaries and benefit costs each showed smaller gains from March to June than in the previous three month period. The largest differences in wages and salaries were in the finance, insurance and real estate industry which had surged 5.2% in the first quarter and was 0.8% higher in Q2, and in wholesale trade (+1.6% in Q1 vs –0.1% in Q2).
Benefit costs in manufacturing, which had jumped 4.0% in the first quarter, gained 1.3% in the second.
Wages and salaries account for roughly 70% of the compensation index and benefit costs comprise about 30%.
| ECI- Private Industry Workers | 2Q'03 | 1Q'03 | Y/Y | 2002 | 2001 | 2000 |
|---|---|---|---|---|---|---|
| Compensation | 0.8% | 1.4% | 3.6% | 3.2% | 4.2% | 4.4% |
| Wages & Salaries | 0.6% | 1.0% | 2.6% | 2.7% | 3.8% | 3.9% |
| Benefit Costs | 1.3% | 2.4% | 6.2% | 4.7% | 5.1% | 5.6% |

Initial claims for unemployment insurance edged down 3,000 in the July 26 week to 388,000 from an upward-revised 391,000 the prior week. This move extends to a second week an encouraging decline in claims below the 400,000 often associated with slack (or even recessionary) conditions in labor markets. It also adds further evidence that the bulge in claims in late June and early July was transitory, due to seasonal plant maintenance in such manufacturing industries as auto, apparel and furniture.
At the same time, the total number of unemployment benefit recipients – also called “continuing claims” – remained high the prior week and the associated “insured unemployment rate” returned to 2.9% from 2.8% the week before. Thus, even as the number of layoffs seems to be receding, it is still relatively difficult for those unemployed to get the new jobs that would remove them from the ranks of the unemployed.
| Unemployment Insurance (000s) | 7/26/03 | 7/19/03 | 7/12/03 | 2002 | 2001 | 2000 |
|---|---|---|---|---|---|---|
| Initial Claims | 388.0 | 391.0 | 415.0 | 404.3 | 406.0 | 299.7 |
| Continuing Claims | -- | 3,648 | 3,585 | 3,575 | 3,022 | 2,114 |
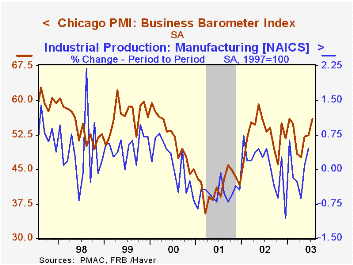
The Chicago Purchasing Managers “Business Barometer” advanced 3.4 points in July to 55.9, its highest reading since January and well ahead of the consensus forecast for a 1.1-point rise. New orders led the gain, picking up nearly 7 points to 61.7, their highest since last November. Production increased 1.9 points, and employment, 2.2. This last however, remains below 50%, indicating the persistence of an adverse balance of layoffs and hires.
Seasonal factors for the overall index are supportive in July, accounting for some of the month-to-month firmness. However, this July’s performance before seasonal adjustment is definitely better than the prior couple of years. The current July saw a decrease in the overall index of about 3 points from June, comparing favorably to declines of almost 8 points in July 2002 and 5 points in July 2001. Thus, there appears to be genuine improvement in manufacturing in the Chicago metropolitan area. Similarly, the Milwaukee Purchasing Managers Index rose from 48 in June to 58 in July. Although frequently more volatile, the Milwaukee survey indicates the geographic breadth of the improvement.
| Chicago Purchasing Managers Index, SA | July | June | May | 2002 | 2001 | 2000 |
|---|---|---|---|---|---|---|
| Business Barometer | 55.9 | 52.5 | 52.2 | 52.7 | 41.4 | 51.8 |
| New Orders | 61.7 | 54.8 | 54.6 | 56.3 | 42.3 | 53.1 |
| Prices Paid | 47.9 | 49.1 | 53.7 | 56.9 | 50.4 | 65.6 |
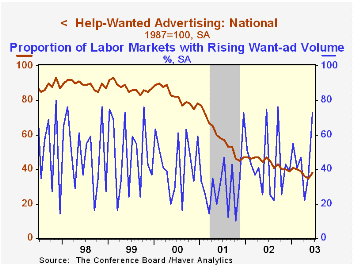
The Conference Board’s National Index of Help-Wanted Advertising increased slightly in June to 38 from its downward revised level of 35 in May. During the last ten years there has been a 92% correlation between the level of help-wanted advertising and the year-to-year % change in nonfarm payrolls.
The proportion of labor markets with rising want-ad volume junped to 73% in June, the highest since September, 2002.
The Conference Board surveys help-wanted advertising volume in 51 major newspapers across the country every month.
| Conference Board | June | May | June2002 |
|---|---|---|---|
| National Help Wanted Index | 38 | 35 | 47 |
Carol Stone, CBE
AuthorMore in Author Profile »Carol Stone, CBE came to Haver Analytics in 2003 following more than 35 years as a financial market economist at major Wall Street financial institutions, most especially Merrill Lynch and Nomura Securities. She had broad experience in analysis and forecasting of flow-of-funds accounts, the federal budget and Federal Reserve operations. At Nomura Securities, among other duties, she developed various indicator forecasting tools and edited a daily global publication produced in London and New York for readers in Tokyo. At Haver Analytics, Carol was a member of the Research Department, aiding database managers with research and documentation efforts, as well as posting commentary on select economic reports. In addition, she conducted Ways-of-the-World, a blog on economic issues for an Episcopal-Church-affiliated website, The Geranium Farm. During her career, Carol served as an officer of the Money Marketeers and the Downtown Economists Club. She had a PhD from NYU's Stern School of Business. She lived in Brooklyn, New York, and had a weekend home on Long Island.
More Economy in Brief


