 Global| Jun 10 2009
Industrial Production’s Slide Begins To Taper Off...For Some
Summary
In April three of five large EU countries experienced monthly increases in industrial production. We can set Spain aside, to some extent, since its monthly figures are so volatile. Still, Spain and the UK are the only two of this [...]
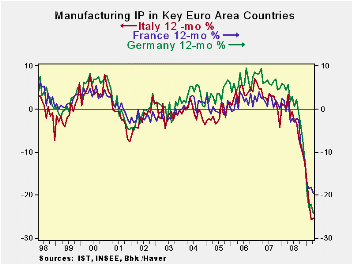
In April three of five large EU countries experienced monthly
increases in industrial production. We can set Spain aside, to some
extent, since its monthly figures are so volatile. Still, Spain and the
UK are the only two of this group to have IP also up over three months.
Only Spain shows IP’s negative growth rates as steadily decelerating
from 12 months to six months to three months, and finally turning
positive. The UK’s positive numbers over three months come without the
persistence of deceleration. All countries in this group except Italy
show that the IP drop is decelerating (or that it is rising) over
three-months compared to six months. And although for Italy the
calculation is a close one, over three months Italy’s IP is falling at
a faster rate than it is falling over 12-mnths; it is the only country
like that.
On balance there is power in numbers and a number of countries
did report an IP bounce in April. That makes the bounce look like a
real phenomenon, not just something aberrant. Most show various
evidence that the IP deceleration is slowing in the recent
three-months. Italy is the exception. Despite posting a rise in IP in
April its trends still are not reassuring. Spain, despite the extreme
volatility in its index shows the most persisting deceleration in the
group. The trick for Spain will be to see if that trend stays in place
next month. The challenge for Italy is to join the progress in the rest
of the group.
| Main E-Area Countries and UK IP in MFG | |||||||
|---|---|---|---|---|---|---|---|
| Mo/Mo | 3-Mo | 6-mo | 12-mo | Apr-09 | |||
| MFG Only | Apr-09 | Mar-09 | Feb-09 | Apr-09 | Apr-09 | Apr-09 | Q:2-Date |
| Germany: | -2.9% | 0.8% | -3.5% | -20.5% | -36.8% | -24.2% | -19.4% |
| France:IPxConstruct'n | -1.4% | -1.7% | -0.9% | -15.0% | -22.5% | -18.8% | -15.8% |
| Italy | 0.7% | -4.7% | -5.0% | -30.9% | -30.6% | -25.2% | -22.7% |
| Spain | 5.8% | -5.0% | 1.2% | 7.1% | -24.7% | -28.6% | 16.7% |
| UK | 0.2% | 0.2% | -0.2% | 0.9% | -15.2% | -12.7% | 1.8% |
| Mo/Mo are simple percent changes others are at saars | |||||||

Robert Brusca
AuthorMore in Author Profile »Robert A. Brusca is Chief Economist of Fact and Opinion Economics, a consulting firm he founded in Manhattan. He has been an economist on Wall Street for over 25 years. He has visited central banking and large institutional clients in over 30 countries in his career as an economist. Mr. Brusca was a Divisional Research Chief at the Federal Reserve Bank of NY (Chief of the International Financial markets Division), a Fed Watcher at Irving Trust and Chief Economist at Nikko Securities International. He is widely quoted and appears in various media. Mr. Brusca holds an MA and Ph.D. in economics from Michigan State University and a BA in Economics from the University of Michigan. His research pursues his strong interests in non aligned policy economics as well as international economics. FAO Economics’ research targets investors to assist them in making better investment decisions in stocks, bonds and in a variety of international assets. The company does not manage money and has no conflicts in giving economic advice.
More Economy in Brief


