 Global| Feb 15 2006
Industrial Production Off Due to Warm Weather
by:Tom Moeller
|in:Economy in Brief
Summary
Overall industrial output fell last month by 0.7% following an upwardly revised 0.9% rise during December. The decline, however, wholly reflected the warm temperatures which reduced utility output by 10.2% (-4.7% y/y). Consensus [...]
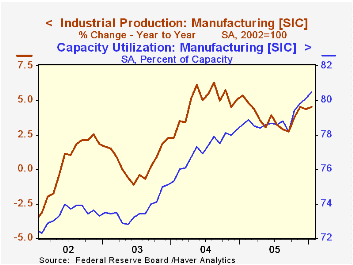
Overall industrial output fell last month by 0.7% following an upwardly revised 0.9% rise during December. The decline, however, wholly reflected the warm temperatures which reduced utility output by 10.2% (-4.7% y/y). Consensus expectations had been for a 0.3% increase in total output.
Factory sector production increased 0.7% (4.5% y/y) following a December increase of 0.4% that was double the initial estimated gain.
A rebound in output of motor vehicles & parts accounted for only some of last month's factory output gain as a 2.3% m/m increase still left production 3.8% below last June's level. Excluding motor vehicles, factory output rose 0.5% (4.7% y/y). Output of appliances, furniture & carpeting recovered 2.1% (3.2% y/y) following three months of decline and clothing output rose 0.3% (1.6% y/y), the third straight monthly increase.
Output of business equipment rose a strong 1.0% (10.7% y/y) led by a 1.6% (24.3% y/y) increase in high tech output. Excluding the high tech sector, factory output rose 0.6% (3.3% y/y) and excluding both autos & high tech factory output rose 0.5% (3.3% y/y).
Total capacity utilization fell to 80.9% but factory sector utilization rose to 80.5%, the highest level since 2000.
Today's testimony by Federal Reserve Board Chairman Ben S. Bernanke is available here.
The complete Monetary Policy Report and the Economic Outlook can be found here.
| Production & Capacity | Jan | Dec | Y/Y | 2005 | 2004 | 2003 |
|---|---|---|---|---|---|---|
| Industrial Production | -0.2% | 0.9% | 3.2% | 3.2% | 4.1% | 0.6% |
| Consumer Goods | -0.4% | 0.3% | 1.8% | 2.1% | 2.1% | 1.0% |
| Business Equipment | 1.0% | 0.6% | 10.7% | 9.0% | 9.3% | 0.0% |
| Capacity Utilization | 80.9% | 81.2% | 79.8% (1/05) | 80.1% | 78.6% | 75.7% |
by Tom Moeller February 15, 2006
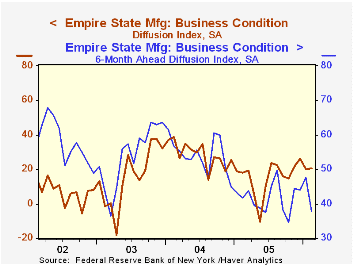
The February Empire State Index of General Business Conditions, published by the Federal Reserve Bank of New York, was roughly stable at 20.31 following the 6.16 point January decline to 20.12. Consensus expectations for the factory sector index had been for the index to fall further to 18.0.
Since the series' inception in 2001 there has been a 76% correlation between the index level and the three month change in factory sector production.
Most of the index components showed the same stability in February. The shipments index dipped marginally after a 13 point rise during January but new orders fell for the second month. The inventory index recouped more than all of a sharp January decline.
An exception was the employment index which reversed about all of a sharp January increase.
Pricing pressure picked up during February as indicated by a 6.3 point jump to the highest level since November.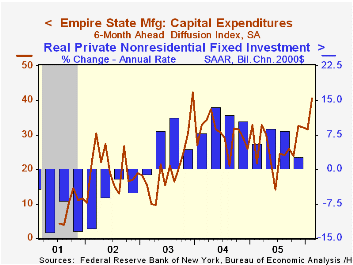
Like the Philadelphia Fed Index of General Business Conditions, the Empire State Business Conditions Index reflects answers to an independent survey question; it is not a weighted combination of the components.
The index of expectations for business conditions in six months fell a sharp 9.7 points to the lowest level since October. Expectations for future capital spending improved sharply.
The Empire State Manufacturing Survey is a monthly survey of manufacturers in New York State conducted by the Federal Reserve Bank of New York. Participants from across the state in a variety of industries respond to a questionnaire and report the change in a variety of indicators from the previous month. Respondents also state the likely direction of these same indicators six months ahead. April 2002 is the first report, although survey data date back to July 2001.
For more on the Empire State Manufacturing Survey, including methodologies and the latest report, click here.
| Empire State Manufacturing Survey | Feb | Jan | Feb '05 | 2005 | 2004 | 2003 |
|---|---|---|---|---|---|---|
| General Business Conditions (diffusion index) | 20.31 | 20.12 | 18.05 | 15.56 | 28.79 | 15.98 |
by Tom Moeller February 15, 2006
The total number of mortgage applications fell 7.3% last week, the third consecutive weekly decline. The declines have been sufficient to reverse virtually all of the 5.2% increase in applications during the month of January.
Purchase applications dropped a sharp 7.9% w/w and added to declines during the prior four months. The average level of purchase applications in February is down 17.6% from the peak month of July last year.
During the last ten years there has been a 50% correlation between the y/y change in purchase applications and the change in new plus existing single family home sales.
Applications to refinance fell 6.5% w/w to the lowest level in one month.
The effective interest rate on a conventional 30-year mortgage rose for the third straight week and settled at 6.52% versus an average 6.34% in January. The effective rate on a 15-year mortgage also rose to 6.21% versus an average 5.98% last month. Interest rates on 15 and 30 year mortgages are closely correlated (>90%) with the rate on 10 year Treasury securities and during the last ten years there has been a (negative) 82% correlation between purchase applications and the effective rate on a 30-Year mortgage.
The Mortgage Bankers Association surveys between 20 to 35 of the top lenders in the U.S. housing industry to derive its refinance, purchase and market indexes. The weekly survey accounts for more than 40% of all applications processed each week by mortgage lenders. Visit the Mortgage Bankers Association site here.
| MBA Mortgage Applications (3/16/90=100) | 02/10/06 | 02/03/06 | Y/Y | 2005 | 2004 | 2003 |
|---|---|---|---|---|---|---|
| Total Market Index | 574.1 | 619.3 | -21.6% | 708.6 | 735.1 | 1,067.9 |
| Purchase | 391.7 | 425.1 | -7.5% | 470.9 | 454.5 | 395.1 |
| Refinancing | 1,636.7 | 1,751.0 | -35.3% | 2,092.3 | 2,366.8 | 4,981.8 |
by Carol Stone February 15, 2006
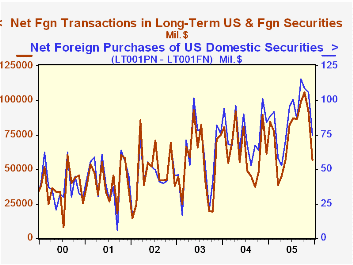
Foreign investors sharply reduced their net purchases of securities from US investors in December, according to the US Treasury's monthly Treasury International Capital ("TIC") data reported this morning. Foreigners bought $74.16 billion in US securities from US resident investors, down from $105.70 billion in November. At the same time, they sold $17.56 billion in foreign securities to US investors, making their overall net transactions with US investors $56.60 billion, down from $91.6 billion in November and the smallest amount since May's $56.57 billion.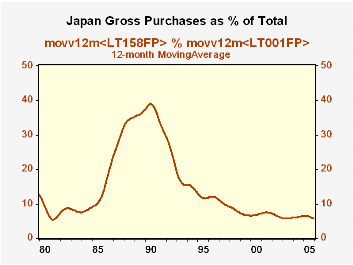
The TIC data, carried in Haver's USINT database, constitute a sizable body of information about interest in US markets from investors in many countries around the world. In the past, Japan has been the prime region absorbing US bonds and stocks. In the second graph, we show this with the share of Japanese gross purchases of US securities. In the late 1980s and early 1990s, Japan's purchase took about 35 - 40% of total foreign purchases. In more recent years, Japanese investors have reduced their buying. Not surprisingly, China's purchases have picked up. Additional monthly data are available on foreign holdings of Treasury securities and these show that Japan's portfolio has flattened. China's has trended consistently higher, but its Treasury ownership is still a mere fraction of Japan's.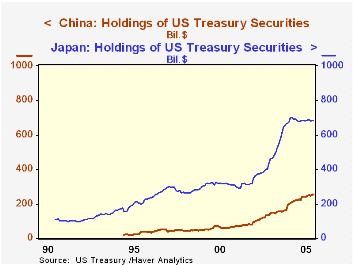
In interpreting these data, it's important to remember that they mark the first transaction between a US investor and a non-US investor. That foreign party may be an intermediary between the American and the final foreign owner. Thus, the UK and Caribbean centers are large purchasers of US securities. But they may not be large "owners". For instance, UK gross purchases of US Treasuries were 9 times as much as those of Japanese investors in 2005, but their holdings of Treasuries at the end of the year were only 34% as much as Japan's. China's holdings are just a little bit larger than the UK's, but they are growing consistently. See the third graph.
| Net Foreign Purchases of Securities from US Investors (Billions US$) | Dec 2005 | Nov 2005 | Oct 2005 | Monthly Averages||||
|---|---|---|---|---|---|---|---|
| 2005 | 2004 | 2003 | 2002 | ||||
| Total | 56.6 | 91.6 | 105.6 | 75.9 | 63.6 | 55.3 | 47.9 |
| Total Domestic Securities | 74.2 | 105.7 | 108.8 | 87.4 | 76.4 | 60.0 | 45.6 |
| Treasuries | 18.5 | 54.5 | 29.2 | 29.2 | 29.3 | 22.0 | 10.0 |
| Federal Agencies (mostly "GSEs") | 9.8 | 9.1 | 34.9 | 18.9 | 18.9 | 13.0 | 16.3 |
| US Corporate Bonds | 37.3 | 37.3 | 36.1 | 32.6 | 25.8 | 22.1 | 15.2 |
| US Corporate Stocks | 8.7 | 4.8 | 8.0 | 6.6 | 2.4 | 2.9 | 4.2 |
| Foreign Bonds | -3.7 | 2.2 | 2.8 | -1.4 | -5.7 | 2.7 | 2.4 |
| Foreign Stocks | -13.8 | -16.4 | -6.0 | -10.1 | -7.1 | -7.4 | -0.1 |

Tom Moeller
AuthorMore in Author Profile »Prior to joining Haver Analytics in 2000, Mr. Moeller worked as the Economist at Chancellor Capital Management from 1985 to 1999. There, he developed comprehensive economic forecasts and interpreted economic data for equity and fixed income portfolio managers. Also at Chancellor, Mr. Moeller worked as an equity analyst and was responsible for researching and rating companies in the economically sensitive automobile and housing industries for investment in Chancellor’s equity portfolio. Prior to joining Chancellor, Mr. Moeller was an Economist at Citibank from 1979 to 1984. He also analyzed pricing behavior in the metals industry for the Council on Wage and Price Stability in Washington, D.C. In 1999, Mr. Moeller received the award for most accurate forecast from the Forecasters' Club of New York. From 1990 to 1992 he was President of the New York Association for Business Economists. Mr. Moeller earned an M.B.A. in Finance from Fordham University, where he graduated in 1987. He holds a Bachelor of Arts in Economics from George Washington University.
More Economy in Brief


