 Global| Aug 17 2004
Industrial Production Increases Less than Expected, But Factories Regain Some Vigor
Summary
Industrial production recovered in July after its June fall. However, the 0.4% gain was less than the 0.5% market forecasters had looked for, and June itself was revised lower, from a 0.3% decline to a 0.5% decline. The hints of [...]
Industrial production recovered in July after its June fall. However, the 0.4% gain was less than the 0.5% market forecasters had looked for, and June itself was revised lower, from a 0.3% decline to a 0.5% decline.
The hints of softness in the production data are concentrated in utilities. Mild weather yielded a 2.5% fall in utility output in June and another 2.1% in July. Production in the important factory sector rebounded 0.6% last month after a 0.2% fall in June.
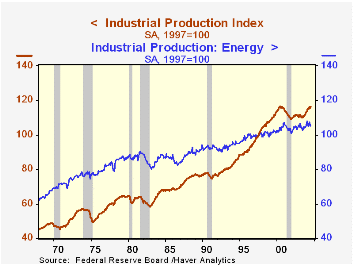
Output of motor vehicles stabilized after following sizable declines in May and June. The high tech sector continued to expand with some vigor; relatively slower growth occurred in March and April, 1.3% and 1.5%, respectively, but the last three months have averaged 2.5% each. Accompanying the lower utility output, energy producers saw their output reduced by 0.6% after a 1.7% drop in June. Other industries' (excluding energy, motor vehicles and high tech) production moderated in July to a 0.3% rise from 0.4% in June. It is evident visually in the graph that US industry has become more economical in its use of energy. Over the 37-year history of the energy data, that output has increased at a 1.5% annualized rate, as total industry has expanded at a 2.7% pace, a "productivity" difference of 1.2 percentage points. However, over the last 15 years, energy output has been slower, at 1.1%, even as total industrial output has picked up to a 2.9% rate, reflecting a larger "productivity" of 1.8 percentage points.
Total capacity utilization increased to 77.1%, although the downward revision to June means that the July increase leaves utilization still below the 77.2% originally calculated for June. Growth in capacity continued at 1.3% y/y.
| Production & Capacity | July | June | Y/Y | 2003 | 2002 | 2001 |
|---|---|---|---|---|---|---|
| Industrial Production | 0.4% | -0.5% | 4.9% | 0.3% | -0.6% | -3.4% |
| Capacity Utilization | 77.1% | 76.9% | 74.5%(7/03) | 74.8% | 75.6% | 77.4% |
Carol Stone, CBE
AuthorMore in Author Profile »Carol Stone, CBE came to Haver Analytics in 2003 following more than 35 years as a financial market economist at major Wall Street financial institutions, most especially Merrill Lynch and Nomura Securities. She had broad experience in analysis and forecasting of flow-of-funds accounts, the federal budget and Federal Reserve operations. At Nomura Securities, among other duties, she developed various indicator forecasting tools and edited a daily global publication produced in London and New York for readers in Tokyo. At Haver Analytics, Carol was a member of the Research Department, aiding database managers with research and documentation efforts, as well as posting commentary on select economic reports. In addition, she conducted Ways-of-the-World, a blog on economic issues for an Episcopal-Church-affiliated website, The Geranium Farm. During her career, Carol served as an officer of the Money Marketeers and the Downtown Economists Club. She had a PhD from NYU's Stern School of Business. She lived in Brooklyn, New York, and had a weekend home on Long Island.
More Economy in Brief


