 Global| Apr 15 2003
Industrial Production Down
by:Tom Moeller
|in:Economy in Brief
Summary
Industrial production fell unexpectedly by 0.5% last month. Consensus expectations had been for a 0.2% decline. The preliminary report that output rose slightly in February was revised to show a slight decline. Despite these declines, [...]
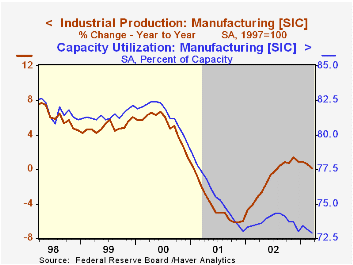
Industrial production fell unexpectedly by 0.5% last month. Consensus expectations had been for a 0.2% decline. The preliminary report that output rose slightly in February was revised to show a slight decline. Despite these declines, output in 1Q rose 0.4% (AR) from 4Q02 due to a strong gain in January. Output fell at a 3.3% rate in 4Q02.
Output in the manufacturing sector fell 0.2% (0.1% y/y). The preliminary report of a 0.1% decline in February output was deepened to a 0.3% decline.
Excluding a 1.9% decline in motor vehicle and parts, down sharply for the second month, factory output was unchanged (-0.3% y/y) in March for the second month. Appliance, furniture & carpeting output fell 0.6% (-1.6% y/y), the second decline this year. Computer, video and audio equipment output fell 0.1% (-1.3% y/y) following a 1.9% February decline. Nondurable consumer goods output fell 0.4% (-1.2% y/y) led by a sharp 1.6% drop in clothing output (-7.8% y/y).
Output of business equipment fell 0.3% (-2.5% y/y) following a downwardly revised 0.3% February decline. Output of industrial equipment fell 0.8% (-0.2% y/y) following two months of gain. Output of information processing equipment rose 1.1% (0.4% y/y).
Total capacity utilization fell sharply to 74.8%, the lowest level since December 2001. Factory sector utilization also fell to 72.9%, the lowest level since mid-1983.
| Production & Capacity | Mar | Feb | Y/Y | 2002 | 2001 | 2000 |
|---|---|---|---|---|---|---|
| Industrial Production | -0.5% | -0.1% | 0.5% | -0.8% | -3.5% | 4.7% |
| Capacity Utilization | 74.8% | 75.3% | 75.3%(3/02) | 75.6% | 77.3% | 82.7% |
by Tom Moeller April 15, 2003
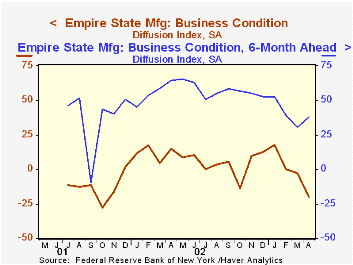
The Empire State Manufacturing Survey index of general business conditions collapsed in April to -20.4. The decline was reported by Federal Reserve Bank of New York. The drop was to the lowest level since October 2001 and was much sharper than Consensus expectations for a reading of -2.0.
Diffusion indexes for all the subgroups fell sharply. The new orders index fell to -15.93, its lowest since October 2001. The employment index also fell sharply to -10.99.
The index of prices paid recouped all of the prior month's decline and rose to 26.53, a record high for this index.
The survey includes measures of business expectations six months ahead. This diffusion index for general business conditions rose sharply to 37.92 led by improved expectations for new orders, shipments and employment. Expectations for capital expenditures remained quite depressed.
The Empire State Manufacturing Survey is a monthly survey of manufacturers in New York State conducted by the Federal Reserve Bank of New York. Participants from across the state in a variety of industries respond to a questionnaire and report the change in a variety of indicators from the previous month. Respondents also state the likely direction of these same indicators six months ahead. April 2002 is the first report, although survey data date back to July 2001.
Like the Philadelphia Fed Index of General Business Conditions, the Empire State Business Conditions Index reflects answers to an independent survey question, not the components.
For the latest Empire State Manufacturing Survey report, click here.
| Empire State Manufacturing Survey | April | Mar | Y/Y | 2002 | 2001 |
|---|---|---|---|---|---|
| General business conditions (diffusion index) | -20.37 | -2.77 | 14.62 | 7.10 | -13.02 |
by Tom Moeller April 15, 2003

Chain store sales rose 1.3% last week according to the BTM-UBSW survey. The gain recouped most of the sharp declines in the prior two weeks.
April sales so far are 0.7% below the March average. March sales finished 0.3% above February after sales fell 0.7% in that month.
During the last ten years there has been a 57% correlation between the year-to-year percent change in these chain store sales and the change in nonauto retail sales less gasoline.
| BTM-UBSW (SA, 1977=100) | 4/12/03 | 4/05/03 | Y/Y | 2002 | 2001 | 2000 |
|---|---|---|---|---|---|---|
| Total Weekly Retail Chain Store Sales | 407.8 | 402.5 | 1.7% | 3.6% | 2.1% | 3.4% |

Tom Moeller
AuthorMore in Author Profile »Prior to joining Haver Analytics in 2000, Mr. Moeller worked as the Economist at Chancellor Capital Management from 1985 to 1999. There, he developed comprehensive economic forecasts and interpreted economic data for equity and fixed income portfolio managers. Also at Chancellor, Mr. Moeller worked as an equity analyst and was responsible for researching and rating companies in the economically sensitive automobile and housing industries for investment in Chancellor’s equity portfolio. Prior to joining Chancellor, Mr. Moeller was an Economist at Citibank from 1979 to 1984. He also analyzed pricing behavior in the metals industry for the Council on Wage and Price Stability in Washington, D.C. In 1999, Mr. Moeller received the award for most accurate forecast from the Forecasters' Club of New York. From 1990 to 1992 he was President of the New York Association for Business Economists. Mr. Moeller earned an M.B.A. in Finance from Fordham University, where he graduated in 1987. He holds a Bachelor of Arts in Economics from George Washington University.
More Economy in Brief


