 Global| Dec 15 2006
Industrial Output Up Slightly
by:Tom Moeller
|in:Economy in Brief
Summary
Total U.S. industrial production ticked 0.2% higher last month but revisions generally had the effect of lowering the gains in output. Consensus expectations had been for a 0.1% November rise. Revisions to the index of industrial [...]
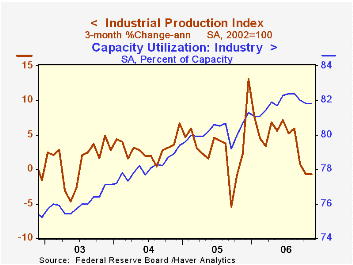
Total U.S. industrial production ticked 0.2% higher last month but revisions generally had the effect of lowering the gains in output. Consensus expectations had been for a 0.1% November rise.
Revisions to the index of industrial production (IP) and the related measures of capacity & capacity utilization reflect the 2004 and 2005 Annual Surveys of Manufactures and selected editions of the 2004 and 2005 Current Industrial Reports.
Factory sector output rose 0.3% but a 0.6% decline during October was double the initial estimate. During the last three months factory sector output is down 0.3% from its August peak.
With a 1.7% (-1.9% y/y) increase, production of durable consumer goods recovered about all of its revised 1.9% October decline as output of automotive products recovered 3.6% (-3.6% y/y). Output of appliances & furniture, however, fell 0.5% (-4.9% y/y) and was off 6.6% from its peak in September 2005. Production of computers, video & audio equipment remained firm and rose 2.3% (13.0% y/y). 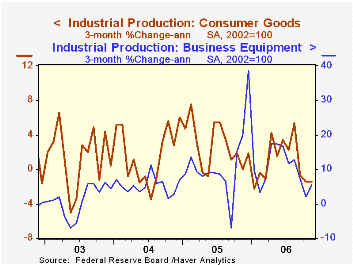
Nondurable consumer goods output slipped 0.1% (2.2% y/y) for the second month in the last three. The gain was softened only by a 1.1% (2.3% y/y) increase in foods & tobacco. Clothing output fell 0.6% (+0.5% y/y), chemical production fell 0.6% (+3.2% y/y) and production of paper products fell 1.4% (+2.2% y/y).
Business equipment production jumped 1.2% but October's increase was lessened to 0.2% from 0.7% reported initially. Output of information processing & equipment rose 1.0% but the 9.9% y/y gain is down from the growth posted earlier this year and those earlier growth rates were revised down. Factory output overall less the hi-tech industries increased 0.1% (2.1% y/y) after two months of sharp decline. Output of transit equipment recovered 2.9% (15.9% y/y) due to a 7.1% (-0.2% y/y) surge in business vehicles.
Overall capacity utilization increased was unchanged from a downwardly revised 81.8% in October. Factory sector utilization, however, increased to 80.2% from a downwardly revised 80.0% in October. Factory sector capacity again rose a firm 0.2% and the 2.7% y/y gain was revised up slightly.The Chinese Economy: Progress and Challenges is today's speech by Federal Reserve Board Chairman Ben S. Bernanke and it is available here.
| Production & Capacity | November | October | Y/Y | 2005 | 2004 | 2003 |
|---|---|---|---|---|---|---|
| Industrial Production | 0.2% | 0.0% | 3.8% | 3.2% | 4.1% | 0.6% |
| Manufacturing (NAICS) | 0.3% | -0.6% | 3.7% | 4.0% | 3.0% | 1.3% |
| Consumer Goods | 0.4% | -0.4% | 1.2% | 2.8% | 1.4% | 1.4% |
| Business Equipment | 1.2% | 0.2% | 9.6% | 7.9% | 4.3% | 0.2% |
| Capacity Utilization | 81.8% | 81.8% | 80.7% (11/05) | 80.2% | 78.1% | 76.1% |

Tom Moeller
AuthorMore in Author Profile »Prior to joining Haver Analytics in 2000, Mr. Moeller worked as the Economist at Chancellor Capital Management from 1985 to 1999. There, he developed comprehensive economic forecasts and interpreted economic data for equity and fixed income portfolio managers. Also at Chancellor, Mr. Moeller worked as an equity analyst and was responsible for researching and rating companies in the economically sensitive automobile and housing industries for investment in Chancellor’s equity portfolio. Prior to joining Chancellor, Mr. Moeller was an Economist at Citibank from 1979 to 1984. He also analyzed pricing behavior in the metals industry for the Council on Wage and Price Stability in Washington, D.C. In 1999, Mr. Moeller received the award for most accurate forecast from the Forecasters' Club of New York. From 1990 to 1992 he was President of the New York Association for Business Economists. Mr. Moeller earned an M.B.A. in Finance from Fordham University, where he graduated in 1987. He holds a Bachelor of Arts in Economics from George Washington University.
More Economy in Brief


