 Global| Dec 23 2004
Income, Services Flows Widen UK Current Account in Q3
Summary
In Q3, the UK experienced its largest current account deficit, £8.8 billion, in 5-1/2 years. The balance gapped by £3.3 billion from the second quarter. While the trade deficit continued to widen, the bigger source of the increase was [...]
In Q3, the UK experienced its largest current account deficit, £8.8 billion, in 5-1/2 years. The balance gapped by £3.3 billion from the second quarter. While the trade deficit continued to widen, the bigger source of the increase was a decrease in the surplus on income. This was due mainly to substantial dividend payments to foreign investors. Transfer payments abroad also increased, by £0.5 billion, reflecting larger payments by both the government and private sectors.
The trade deficit itself set a record at £10.3 billion, but the widening in the goods balance was a slim £0.1 billion. The surplus on services narrowed by £0.5 billion as exports retreated from an all-time high in Q2, and imports of services rose slightly. Conventional wisdom generally ties current account developments with changes in the balance of trade in goods. But as seen here, that input was trivial in Q3, while other factors in services and incomes generated the large current account deficit.
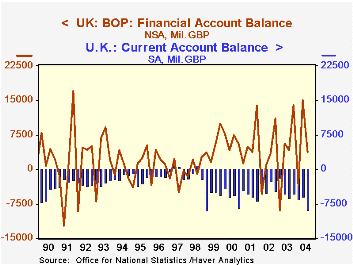
This combination of current flows well illustrates the openness of UK markets to dealings with foreign traders of both goods and various kinds of services and financing. This porousness is further shown by the wide swings on the other side of the balance of payments, the financial accounts. Net inflows of capital funds in Q2 had amounted to £15.0 billion, the second highest ever. This financial balance retreated in Q3 to just under £4.0 billion. Since the current account deficit widened, balance was achieved artificially with the "net errors and omissions" item, which swung from net outflow of £7.9 billion to a net inflow of £3.6 billion. As with the financial account in Q2, the net errors and omissions item in that period was one of the largest ever. It's hardly surprising that such major changes followed in Q3.
| Seasonally Adjusted, Billions of £ | Q3 2004 | Q2 2004 | Q3 2003 | Quarterly Averages|||
|---|---|---|---|---|---|---|
| 2003 | 2002 | 2001 | ||||
| Current Account | -8.8 | -5.8 | -6.1 | -4.6 | -4.4 | -5.6 |
| Trade in Goods & Services | -10.3 | -9.6 | -8.3 | -8.0 | -7.8 | -6.9 |
| Income | +4.4 | +6.1 | +4.6 | +5.8 | +5.5 | +2.9 |
| Current Transfers | -2.9 | -2.4 | -2.5 | -2.5 | -2.1 | -1.7 |
| Not Seasonally Adjusted | ||||||
| Capital Account | +0.3 | +0.6 | +0.3 | +0.3 | +0.2 | +0.3 |
| Financial Account | +3.9 | +15.0 | +4.2 | +3.7 | +2.6 | +6.0 |
| Net Errors & Omissions* | +3.6 | -7.9 | +1.1 | +0.6 | +1.6 | -0.7 |
Carol Stone, CBE
AuthorMore in Author Profile »Carol Stone, CBE came to Haver Analytics in 2003 following more than 35 years as a financial market economist at major Wall Street financial institutions, most especially Merrill Lynch and Nomura Securities. She had broad experience in analysis and forecasting of flow-of-funds accounts, the federal budget and Federal Reserve operations. At Nomura Securities, among other duties, she developed various indicator forecasting tools and edited a daily global publication produced in London and New York for readers in Tokyo. At Haver Analytics, Carol was a member of the Research Department, aiding database managers with research and documentation efforts, as well as posting commentary on select economic reports. In addition, she conducted Ways-of-the-World, a blog on economic issues for an Episcopal-Church-affiliated website, The Geranium Farm. During her career, Carol served as an officer of the Money Marketeers and the Downtown Economists Club. She had a PhD from NYU's Stern School of Business. She lived in Brooklyn, New York, and had a weekend home on Long Island.
More Economy in Brief


