 Global| Jan 06 2004
Incentives Spur U.S. Light Vehicle Sales
by:Tom Moeller
|in:Economy in Brief
Summary
Light vehicle sales added 7.2% in December to the 7.7% November gain and rose to 18.06M, the second highest monthly selling rate for the year. Consensus expectations had been for sales of 17.0M. For the year, light vehicle sales fell [...]
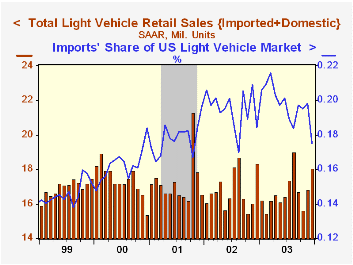
Light vehicle sales added 7.2% in December to the 7.7% November gain and rose to 18.06M, the second highest monthly selling rate for the year. Consensus expectations had been for sales of 17.0M.
For the year, light vehicle sales fell 0.6% versus 2002 to 16.71M. The peak for annual sales was in 2000 at 17.40M.
Cash rebates of up to $5,000 were successful in lifting sales of light trucks to 10.24M, up 12.9% m/m.
Car sales rose slightly in December to 7.82M. For 2003, sales fell for the third straight year to 7.64M. The peak for car sales was in 1986 at 11.41M.
Domestic light vehicle sales rose 10.3% m/m to 14.89M as truck sales jumped 15.4% m/m (3.8% y/y).
Imported vehicle sales fell 5.3% m/m to 3.16M (-6.4% y/y). Imports captured 17.5% of the US market for new vehicles in December and 19.8% for the year.
| Light Vehicle Sales (SAAR, Mil.Units) | Dec | Nov | Y/Y | 2003 | 2002 | 2001 |
|---|---|---|---|---|---|---|
| Total | 18.06 | 16.84 | -1.4% | 16.71 | 16.81 | 17.26 |
| Autos | 7.82 | 7.77 | -7.1% | 7.64 | 8.07 | 8.48 |
| Light Trucks | 10.24 | 9.07 | 3.4% | 9.07 | 8.74 | 8.78 |
by Tom Moeller January 6, 2004
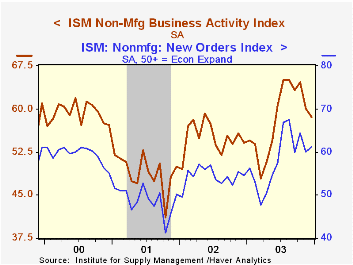
The Business Activity Index for the non-manufacturing sector, reported by the Institute for Supply Management, fell in December to 58.6 versus 60.1 in November and 64.7 in October. Consensus expectations had been for little change at 60.5.
Since the series' inception in 1997 there has been a 58% correlation between the level of the ISM non-manufacturing business activity index and the quarterly change in real GDP for services plus construction.
The employment index dipped modestly to 54.0 versus the strong reading of 54.9 in November.
Since the series' inception in 1997 there has been a 64% correlation between the level of the ISM non-manufacturing employment index and the m/m change in payroll employment in the service producing and construction industries.
New orders improved to a reading of 61.2 versus 60.1 the prior month.Business activity for the non-manufacturing sector is a question separate from the subgroups mentioned above. In contrast, the NAPM manufacturing sector composite index weights the components.
The seasonally adjusted prices index rose to 60.0 in December and for the year stood at the highest level since 2000.
ISM surveys more than 370 purchasing managers in more than 62 industries including construction, law firms, hospitals, government and retailers. The non-manufacturing survey dates only to July 1997, therefore its seasonal adjustment should be viewed tentatively.
| ISM Nonmanufacturing Survey | Dec | Nov | Y/Y | 2003 | 2002 | 2001 |
|---|---|---|---|---|---|---|
| Business Activity Index | 58.6 | 60.1 | 54.2 | 58.3 | 55.1 | 49.0 |
| Prices Index | 60.0 | 58.0 | 55.3 | 56.7 | 53.9 | 51.6 |
by Tom Moeller January 6, 2004
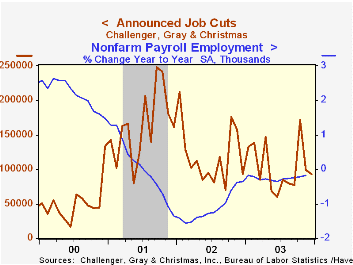
Announced job cuts in December fell 6.5% m/m and pulled the full year figure down 13.6% versus 2003 according to Challenger, Gray & Christmas.
The three month moving average of job cut announcements again rose (-14.6% y/y) due to a spike in layoffs in October.
Announced layoffs fell the services (-16.0% in 2003), electronics (-18.5% in 2003), telecommunications (-58.6% in 2003) and transportation (-32.2% in 2003) industries. Job cut announcements rose m/m in the aerospace (-36.1% in 2003), apparel (+69.6% in 2003), automotive (-33.1% in 2003), chemical (+1.5% in 2003), computer (-52.6% in 2003), financial (-42.0% in 2003) and pharmaceutical (+148.3% in 2003) industries.
Job cut announcements differ from layoffs in that many are achieved through attrition or just never occur.
During the last ten years there has been an 83% (inverse) correlation between the three month average level of announced job cuts and the y/y percent change payroll employment.
| Challenger, Gray & Christmas | Dec | Nov | Y/Y | 2003 | 2002 | 2001 |
|---|---|---|---|---|---|---|
| Announced Job Cuts | 93,020 | 99,452 | 0.1% | 1,236,426 | 1,431,052 | 1,956,876 |
by Tom Moeller January 6, 2004
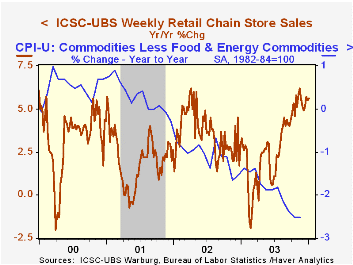
Chain store sales slipped 0.1% the opening week of the New Year, according to the ICSC-UBS survey. The dip followed strong gains in the prior three weeks. For the year, weak pricing power pulled the rise in sales down to 2.9% versus a 3.6% gain in 2002.
December sales fell 0.3% versus the November average. In November, sales rose 0.5% versus the prior month.
During the last five years there has been a 61% correlation between the year-to-year percent change in the ICSC-UBS measure of chain store sales and the change in non-auto retail sales less gasoline.
The ICSC-UBS retail chain-store sales index is constructed using the same-store sales reported by 78 stores of seven retailers: Dayton Hudson, Federated, Kmart, May, J.C. Penney, Sears and Wal-Mart.
| ICSC-UBS (SA, 1977=100) | 01/03/04 | 12/27/03 | Y/Y | 2003 | 2002 | 2001 |
|---|---|---|---|---|---|---|
| Total Weekly Retail Chain Store Sales | 430.9 | 431.4 | 5.6% | 2.9% | 3.6% | 2.1% |
by Tom Moeller January 6, 2004
Factory orders fell an expected 1.4% in November. The advance report of a 3.1% drop in durable goods orders was revised shallower to a 2.5% decline. Orders for computers fell 1.2% (+31.0% y/y) Non-durable goods orders fell 0.2% (+4.5% y/y).
A report titled "Computer Use and Productivity Growth" from the Federal Reserve Bank of St. Louis can be found here.
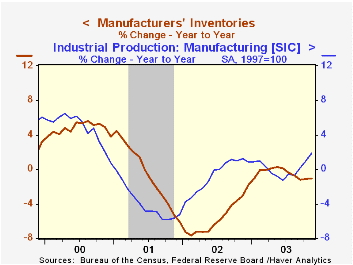
Manufacturing inventories fell 0.2% following the slight increase in October. Excluding the defense industry inventories fell 0.2% (-1.7% y/y) and have fallen in each of the last nine months.
Factory shipments were unchanged. Shipments excluding transportation fell 0.3% (4.2% y/y).
| Factory Survey (NAICS) | Nov | Oct | Y/Y | 2002 | 2001 | 2000 |
|---|---|---|---|---|---|---|
| Inventories | -0.2% | 0.1% | -1.0% | -1.8% | -6.1% | 3.8% |
| New Orders | -1.4% | 2.4% | 6.0% | -1.9% | -6.7% | 5.0% |
| Shipments | 0.0% | 0.7% | 4.1% | -2.0% | -5.4% | 4.2% |
| Unfilled Orders | 0.7% | 1.7% | 3.4% | -6.1% | -5.9% | 8.7% |

Tom Moeller
AuthorMore in Author Profile »Prior to joining Haver Analytics in 2000, Mr. Moeller worked as the Economist at Chancellor Capital Management from 1985 to 1999. There, he developed comprehensive economic forecasts and interpreted economic data for equity and fixed income portfolio managers. Also at Chancellor, Mr. Moeller worked as an equity analyst and was responsible for researching and rating companies in the economically sensitive automobile and housing industries for investment in Chancellor’s equity portfolio. Prior to joining Chancellor, Mr. Moeller was an Economist at Citibank from 1979 to 1984. He also analyzed pricing behavior in the metals industry for the Council on Wage and Price Stability in Washington, D.C. In 1999, Mr. Moeller received the award for most accurate forecast from the Forecasters' Club of New York. From 1990 to 1992 he was President of the New York Association for Business Economists. Mr. Moeller earned an M.B.A. in Finance from Fordham University, where he graduated in 1987. He holds a Bachelor of Arts in Economics from George Washington University.
More Economy in Brief


