 Global| Feb 19 2003
Housing Starts Strong Again
by:Tom Moeller
|in:Economy in Brief
Summary
Housing starts were stronger than expected last month. Total starts rose slightly from an upwardly revised December level. Starts had been expected to decline slightly. Single family starts rose 2.1% m/m, nearly to the record high [...]

Housing starts were stronger than expected last month. Total starts rose slightly from an upwardly revised December level. Starts had been expected to decline slightly.
Single family starts rose 2.1% m/m, nearly to the record high level set in 1978.
Multi-family starts fell for the first month in three. The y/y comparison was to a strong January last year.
Building permits fell and gave back roughly half of a very strong December gain that was upwardly revised. The decline was entirely due to a drop in permits for five or more unit structures. Single family permits rose modestly m/m to a record level.
A strong seasonal factor lifted the adjusted level of housing starts last month by 29% versus a 24% add in December and a 10% addition in November.
| Housing Starts (000s, AR) | Jan | Dec | Y/Y | 2002 | 2001 | 2000 |
|---|---|---|---|---|---|---|
| Total | 1,850 | 1,847 | 8.0% | 1,711 | 1,603 | 1,573 |
| Single Family | 1,510 | 1,479 | 12.4% | 1,365 | 1,273 | 1,232 |
| Multi Family | 340 | 368 | -7.9% | 347 | 330 | 341 |
| Building Permits | 1,781 | 1,887 | 5.6% | 1,717 | 1,639 | 1,598 |
by Tom Moeller February 19, 2003
The National Association of Home Builders Housing Market Index fell in February, down for the second month. Despite the declines, the index remained at the firmest level since 1999.
Surveys of market conditions for current sales were stable. Expected sales in six months fell to the lowest level since August.
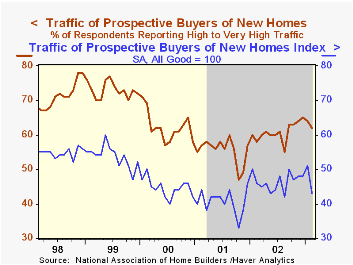
Traffic of prospective buyers fell sharply. This survey was taken prior to the snowstorm in the East.
For a description of the housing market index from the National Association of Home Builders, visit the NAHB website.
| Nat'l Association of Home Builders | Feb | Jan | Y/Y | 2002 | 2001 | 2000 |
|---|---|---|---|---|---|---|
| Composite Housing Market Index | 62 | 64 | 58 | 61 | 56 | 62 |
by Tom Moeller February 19, 2003

Chain store sales fell a slight 0.1% last week according to the BTM-UBSW survey. The decline followed flat sales the week prior and a sharp decline late in January.
February sales so far are down 0.3% from the January average. The year-to-year comparison went negative due to a sales surge during mid-February last year.
The y/y gain in Redbook Same Store sales remained positive despite a similar sales surge last year.
During the last ten years there has been a 56% correlation between the year-to-year percent change in monthly chain store sales and the change in nonauto retail sales less gasoline.
| BTM-UBSW (SA, 1977=100) | 2/15/03 | 2/08/03 | Y/Y | 2002 | 2001 | 2000 |
|---|---|---|---|---|---|---|
| Total Weekly Retail Chain Store Sales | 408.3 | 408.9 | -1.5% | 3.6% | 2.1% | 3.4% |

Tom Moeller
AuthorMore in Author Profile »Prior to joining Haver Analytics in 2000, Mr. Moeller worked as the Economist at Chancellor Capital Management from 1985 to 1999. There, he developed comprehensive economic forecasts and interpreted economic data for equity and fixed income portfolio managers. Also at Chancellor, Mr. Moeller worked as an equity analyst and was responsible for researching and rating companies in the economically sensitive automobile and housing industries for investment in Chancellor’s equity portfolio. Prior to joining Chancellor, Mr. Moeller was an Economist at Citibank from 1979 to 1984. He also analyzed pricing behavior in the metals industry for the Council on Wage and Price Stability in Washington, D.C. In 1999, Mr. Moeller received the award for most accurate forecast from the Forecasters' Club of New York. From 1990 to 1992 he was President of the New York Association for Business Economists. Mr. Moeller earned an M.B.A. in Finance from Fordham University, where he graduated in 1987. He holds a Bachelor of Arts in Economics from George Washington University.
More Economy in Brief


