 Global| Oct 17 2003
Housing Starts Rebound in September
Summary
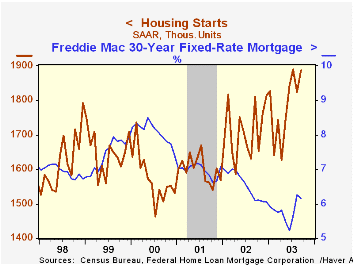
Housing starts rebounded in September by 3.4%, almost exactly offsetting their August decline. At a 1.888 million annual rate, they stood just 2,000 off the 17-year high of 1.890 million reached in July. Forecasters underestimated [...]

Housing starts rebounded in September by 3.4%, almost exactly offsetting their August decline. At a 1.888 million annual rate, they stood just 2,000 off the 17-year high of 1.890 million reached in July. Forecasters underestimated this strength, anticipating that starts would remain close to the relatively lower July figure. Revisions to July and August figures were inconsequential.
Single family starts rose 3.1% m/m. The Midwest and West showed the largest increases and those in the South actually declined somewhat.
Multi-family starts advanced 4.5%, last month, led by starts of 2-4 unit structures, i.e., townhouses. For all multi-unit structures, starts were up most in the Northeast, with small increases in the Midwest and South and some decline in the West.
Building permits have had the reverse monthly pattern from starts, as they rose an upwardly revised 5.6% in August and edged back down 2.2% in September. The backlog of homes authorized but not started was nearly steady at 178,100 in September (actual monthly amount, not seasonally adjusted or annualized) compared with 179,000 in August. This backlog is down slightly from its peaks in the spring, providing a slight hint that the housing market might be on the verge of slowing down. However, historically housing demand has sometimes firmed briefly after interest rates have begun to rise as home builders and buyers rush to capture low mortgage rate financing. So such a high volume of starts as occurred in September would not be a surprising response to the rise in rates over the summer.
| Housing Starts (000s, AR) | Sept | Aug | July | Y/Y | 2002 | 2001 | 2000 |
|---|---|---|---|---|---|---|---|
| Total | 1,888 | 1,826 | 1,890 | 4.3% | 1,711 | 1,601 | 1,573 |
| Single-family | 1,520 | 1,474 | 1,533 | 4.9% | 1,364 | 1,272 | 1,232 |
| Multi-family | 368 | 352 | 357 | 1.9% | 347 | 330 | 341 |
| Building Permits | 1,860 | 1,901 | 1,800 | 3.2% | 1,750 | 1,637 | 1,598 |
by Tom Moeller October 17, 2003

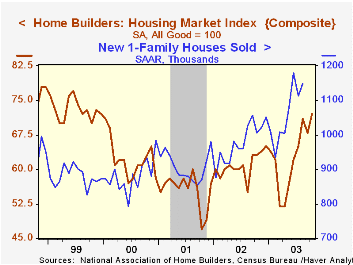
The National Association of Home Builders (NAHB) reported that their Composite Housing Market Index rose for October to 72 (+14.3% y/y). That is the highest level since December 1999 and the monthly gain retraced all of a moderate September decline.
During the last fifteen years there has been a 68% correlation between the y/y change in the NAHB index and the change in new home sales.
The index of current market conditions for home sales jumped 8.2% m/m to 79 (14.5% y/y).
The index which measures expected home sales in six months rose 5.1% m/m to 82 (20.6 y/y).
Traffic of prospective buyers picked up and reversed half of a moderate decline in September.
The NAHB index is a diffusion index based on a survey of builders. Readings above 50 signal that more builders view conditions as good than poor.
Visit the National Association of Home Builders using this link.
| Nat'l Association of Home Builders | Oct | Sept | Y/Y | 2002 | 2001 | 2000 |
|---|---|---|---|---|---|---|
| Composite Housing Market Index | 72 | 68 | 63 | 61 | 56 | 62 |
by Carol Stone October 17, 2003

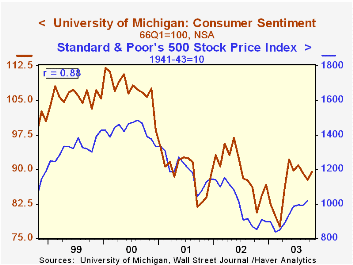
The University of Michigan’s consumer sentiment index picked up in early October, rising to 89.4 (1966Q1 = 100) from September's final 87.7. This early October move basically reversed the decline in September.
An improvement in Current Economic Conditions provided the primary support. This may have resulted from the better employment conditions reported for September or the better trend in the stock market or both. As seen in the accompanying graph, there is a fairly well defined relationship between the overall sentiment index and the movement in stock prices, about an 88% correlation over the past five years. Carrying the connection to the next link in the chain, sentiment further has maintained an 82% correlation with the year-on-year growth in real consumer spending over that same time span.
The Index of Consumer Expectations also rose, but much more modestly.
The University of Michigan survey is not seasonally adjusted.It is based on telephone interviews with 250 households nationwide on personal finances and business and buying conditions. The survey is expanded to a total of 500 interviews at month end.
| University of Michigan | Early Oct | Sept | Aug | Y/Y | 2002 | 2001 | 2000 |
|---|---|---|---|---|---|---|---|
| Consumer Sentiment | 89.4 | 87.7 | 89.3 | 10.9% | 89.6 | 89.2 | 107.6 |
| Current Conditions | 102.2 | 98.4 | 99.7 | 10.6% | 97.5 | 100.1 | 115.2 |
| Index of Consumer Expectations | 81.2 | 80.8 | 82.5 | 11.1% | 84.6 | 82.3 | 102.7 |
Carol Stone, CBE
AuthorMore in Author Profile »Carol Stone, CBE came to Haver Analytics in 2003 following more than 35 years as a financial market economist at major Wall Street financial institutions, most especially Merrill Lynch and Nomura Securities. She had broad experience in analysis and forecasting of flow-of-funds accounts, the federal budget and Federal Reserve operations. At Nomura Securities, among other duties, she developed various indicator forecasting tools and edited a daily global publication produced in London and New York for readers in Tokyo. At Haver Analytics, Carol was a member of the Research Department, aiding database managers with research and documentation efforts, as well as posting commentary on select economic reports. In addition, she conducted Ways-of-the-World, a blog on economic issues for an Episcopal-Church-affiliated website, The Geranium Farm. During her career, Carol served as an officer of the Money Marketeers and the Downtown Economists Club. She had a PhD from NYU's Stern School of Business. She lived in Brooklyn, New York, and had a weekend home on Long Island.
More Economy in Brief
 Global| Feb 05 2026
Charts of the Week: Balanced Policy, Resilient Data and AI Narratives
by:Andrew Cates


