 Global| Jun 20 2006
Housing Starts Rebound
by:Tom Moeller
|in:Economy in Brief
Summary
Housing starts rebounded 5.0% last month to 1.957M units and recovered about all of the April decline that was revised slightly shallower. The rise by far exceeded Consensus expectations for stability at 1.869M starts. Total housing [...]
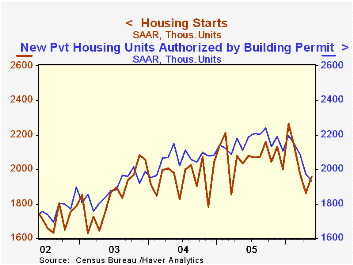
Housing starts rebounded 5.0% last month to 1.957M units and recovered about all of the April decline that was revised slightly shallower. The rise by far exceeded Consensus expectations for stability at 1.869M starts.
Total housing starts nevertheless remained 13.6% below the peak this past January.
Most of the surprise last month was due to a 19.7% m/m jump in multi family starts which reversed a sharp April decline. For the first five months of this year multi family starts averaged 362M units, equal to the first five months of 2005.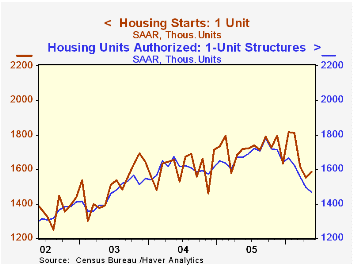
Single-family starts recovered just a piece of the prior months' weakness and rose 2.1% to 1.586M units after three months of decline. During the first five months of this year single family starts were 1.5% below the first five months of 2005 and in May were 12.6% below the January peak.
By region, single family housing starts were weakest in the Midwest and posted a 15.6% (-25.4% y/y) decline. In the Northeast starts also slipped by 0.7% (-1.5% y/y) but in the South single family starts rose 8.2% (1.3% y/y). Out West starts rose 4.6% (-12.1% y/y).
Building permits fell for the fourth consecutive month. The 2.1% decline lowered permits 13.8% below the peak last September and reflected a 2.1% (-12.2% y/y) drop in permits to build single family homes. Single family permits in May were down 17.5% from the peak last September.
A Supervisor's Perspective on Mortgage Markets and Mortgage Lending Practices from Federal Reserve Governor Susan Schmidt Bies is available here.
| Housing Starts (000s, AR) | May | April | Y/Y | 2005 | 2004 | 2003 |
|---|---|---|---|---|---|---|
| Total | 1,957 | 1,863 | -3.8% | 2,073 | 1,950 | 1,854 |
| Single-family | 1,586 | 1,553 | -7.6% | 1,719 | 1,604 | 1,505 |
| Multi-family | 371 | 310 | 17.0% | 354 | 345 | 349 |
| Building Permits | 1,932 | 1,973 | -8.5% | 2,144 | 2,057 | 1,8 88 |
by Tom Moeller June 20, 2006
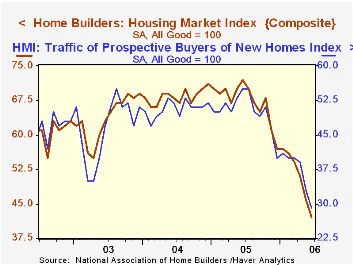
The National Association of Home Builders' (NAHB) reported that the June Composite Housing Market Index at 45 fell another 8.7% from May to the lowest level since April 1995. The figure matched Consensus expectations.
During the last twenty years there has been a 75% correlation between the y/y change in the Composite Index and the change in single family housing starts.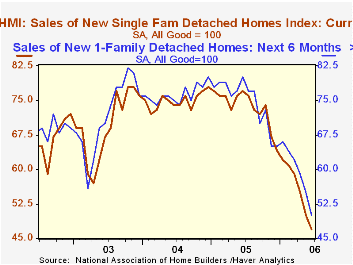
The sub indexes covering current sales of single family homes (-39.0% y/y) and sales in the next six months (-37.5% y/y) were both down sharply m/m.
An index of the traffic of prospective home buyers dried up and fell 12.1% m/m (-47.3% y/y).
Housing markets around the country again were weak in June with the index for the Northeast off 14.9% (-43.7% y/y), in the Midwest off 13.8% (-51.9% y/y), out West down 1.6% (-31.5% y/y) and in the South off 3.9% (-36.4% y/y).
The NAHB index is a diffusion index based on a survey of builders. Readings above 50 signal that more builders view conditions as good than poor.
Visit the National Association of Home Builders.
| Nat'l Association of Home Builders | June | May | June '05 | 2005 | 2004 | 2003 |
|---|---|---|---|---|---|---|
| Composite Housing Market Index | 45 | 51 | 70 | 67 | 68 | 64 |
by Tom Moeller June 20, 2006
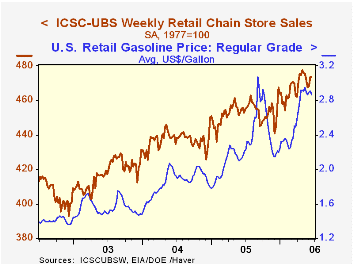
The International Council of Shopping Centers (ICSC)-UBS reported that chain store sales were stable last week following a 1.2% surge during the prior week.
Sales so far in June are 0.2% below the May average which fell 0.4% from April. During the last ten years there has been a 47% correlation between the y/y change in chain store sales and the change in nonauto retail sales less gasoline.The ICSC-UBS retail chain-store sales index is constructed using the same-store sales (stores open for one year) reported by 78 stores of seven retailers: Dayton Hudson, Federated, Kmart, May, J.C. Penney, Sears and Wal-Mart.
The leading indicator of chain store sales from ICSC-UBS recovered another 1.0% (-2.2% y/y), up for the third week after several consecutive weeks of decline.
Retail gasoline prices fell four cents last week to an average $2.87 per gallon and reversed most of the increase during the prior two weeks. In spot market trading gasoline prices fell a nickel yesterday to $1.93 per gallon and were down a bit more than that from last week's average $1.99.
The just-released 2006 International Energy Outlook from the U.S. Energy Information Administration is available here.
| ICSC-UBS (SA, 1977=100) | 06/17/06 | 06/10/06 | Y/Y | 2005 | 2004 | 2003 |
|---|---|---|---|---|---|---|
| Total Weekly Chain Store Sales | 473.6 | 473.6 | 3.9% | 3.6% | 4.7% | 2.9% |
by Louise Curley June 20, 2006
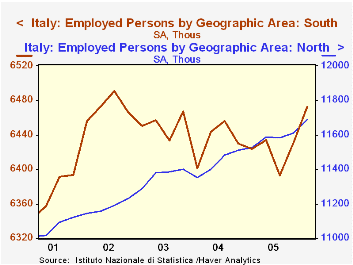
Italy's labor force survey for the first quarter shows commendable improvement in the employment situation throughout the country. Total employment rose almost 1% to 22.8 million in the first quarter from the last quarter of 2005 and was 1.2% above the first quarter or 2005. Employment in the North, where more than half the work force is employed, increased 1.2% over a year ago, while employment in the Central Region, where about 20% of the work force is employed, increased 1.9% over a year ago. Even in the depressed South, where almost 30% of the work force is employed, employment increased 0.6% above a year ago. Employment in the North and Central Regions has grown virtually steadily over the past five years while employment in the south has, more or less, stagnated. The first chart contrasts the trends in employment in the North and the South.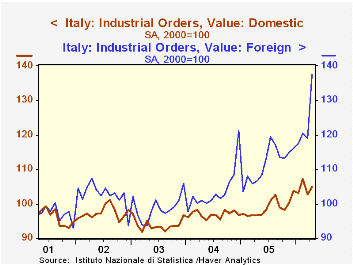
The unemployment rate for the country as a whole was 7.4%, the lowest rate during the period for which data are available (Fourth quarter of 1992 to date). In the North the unemployment rate was 4.1%, in the central region, 6.1% and in the depressed south region, 13.6%. This last figure is also the lowest rate during the period for which data are available and is down from a peak of 19.7% in the second quarter of 1988.
Industrial orders for April rose 6.8% in the month and were 15.5% above a year ago. The big rise took place in export orders which rose 15.6% in the month and were 29.0% above a year ago. The increases in domestic orders were more subdued, 2.2% and 8.7%, respectively. The second chart shows the indexes (2000=100) for domestic and export orders.
Industrial sales declined in April from March, but were 5.7% above April, 2005. Domestic sales were 4.6% and foreign sales, 8.2% above their respective April, 2005 values.
| Italy | Apr 06 | Mar 05 | Apr 05 | M/M | Y/Y | 2005 | 2004 | 2003 |
|---|---|---|---|---|---|---|---|---|
| Industrial Orders (2000=100) | 115.0 | 107.7 | 99.6 | 6.78 | 15.46 | 102.0 | 98.9 | 95.4 |
| Domestic | 105. | 102.7 | 96.6 | 2.24 | 8.70 | 98.9 | 96.8 | 93.9 |
| Foreign | 137.5 | 119.0 | 106.6 | 15.55 | 25.99 | 111.6 | 103.6 | 98.7 |
| Industrial Sales (2000=100) | 112.8 | 115.0 | 106.7 | -1.91 | 5.72 | 107.6 | 104.1 | 101.8 |
| Domestic | 110.9 | 112.8 | 106.0 | -1.68 | 4.62 | 106.4 | 104.1 | 101.9 |
| Foreign | 117.7 | 120.8 | 108.8 | -2.57 | 8.18 | 110.8 | 104.1 | 101.4 |
| Q1 06 | Q4 05 | Q1 05 | Q/Q | Y/Y | 20 05 | 2004 | 2003 | |
| Employment (thousands) | 22,814 | 22,598 | 22,549 | 0.96 | 1.18 | 22,571 | 22,404 | 22,240 |
| North | 11,687 | 11,601 | 11,546 | 0.74 | 1.22 | 11,591 | 11,433 | 11,364 |
| Central | 4,655 | 45-,594 | 4,567 | 1.32 | 1.93 | 4,577 | 4,539 | 4,424 |
| South | 6,472 | 6,403 | 6,436 | 1.08 | 0.56 | 6,414 | 6,431 | 6,452 |
| Unemployment Rate | 7.4 | 7.7 | 7.8 | -0.3 | -0.4 | 7.7 | 8.8 | 8.4 |
| North | 4.1 | 4.3 | 4.3 | -0.2 | -0.2 | 4.2 | 4.3 | 4.1 |
| Central | 6.1 | 6.6 | 6.3 | -0.5 | -0.2 | 6.4 | 6.5 | 6.9 |
| South | 13.6 | 14.0 | 14.5 | -0.4 | -0.9 | 14.3 | 14.9 | 16.1 |

Tom Moeller
AuthorMore in Author Profile »Prior to joining Haver Analytics in 2000, Mr. Moeller worked as the Economist at Chancellor Capital Management from 1985 to 1999. There, he developed comprehensive economic forecasts and interpreted economic data for equity and fixed income portfolio managers. Also at Chancellor, Mr. Moeller worked as an equity analyst and was responsible for researching and rating companies in the economically sensitive automobile and housing industries for investment in Chancellor’s equity portfolio. Prior to joining Chancellor, Mr. Moeller was an Economist at Citibank from 1979 to 1984. He also analyzed pricing behavior in the metals industry for the Council on Wage and Price Stability in Washington, D.C. In 1999, Mr. Moeller received the award for most accurate forecast from the Forecasters' Club of New York. From 1990 to 1992 he was President of the New York Association for Business Economists. Mr. Moeller earned an M.B.A. in Finance from Fordham University, where he graduated in 1987. He holds a Bachelor of Arts in Economics from George Washington University.
More Economy in Brief


