 Global| Dec 09 2004
Households' Net Worth Improved Further
by:Tom Moeller
|in:Economy in Brief
Summary
The net worth of the US household sector rose 10.2% last quarter versus 3Q03. The year to year rate of increase is slower than the 14.4% gain in 1Q04. The rise was driven by a 10.0% y/y rise in total asset values. Tangible asset [...]
The net worth of the US household sector rose 10.2% last quarter versus 3Q03. The year to year rate of increase is slower than the 14.4% gain in 1Q04.
The rise was driven by a 10.0% y/y rise in total asset values. Tangible asset values rose 13.1% y/y as the value of real estate holdings surged 15.4%. Financial asset values rose a lesser 8.2%, held back by higher interest rates which lowered the value of treasury issues by 19.1%. Money market share values also fell 11.6%. Higher prices in the stock market helped lift the value of mutual fund shares by 18.1% and the value of corporate equities held directly by 7.5%.
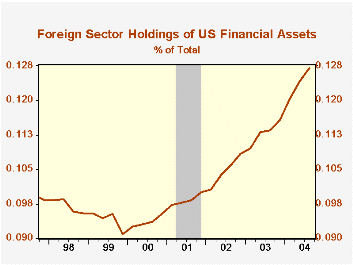
Foreign sector holdings of total US assets rose 20.7% y/y raising the foreign sector's ownership share of total US financial assets to an upwardly revised 12.7% versus 7.0% ten years ago.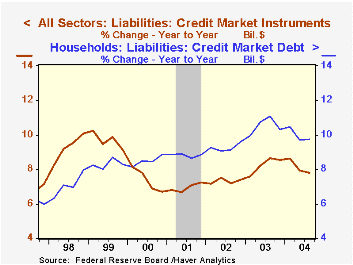
Growth in total credit market debt outstanding was steady at 7.8%. The federal government and US households continued growing debt at or about a double digit rate and nonfinancial corporations' debt grew just 3.3%.
Total credit market debt owed by the household sector rose 9.8% y/y as home mortgage debt rose 11.5%. Consumer credit rose 4.3%.
| Flow of Funds (Y/Y Chg.) | % of Total | 3Q04 | 2Q04 | 2003 | 2002 | 2001 |
|---|---|---|---|---|---|---|
| Total Credit Market Debt Outstanding | 7.8% | 7.9% | 8.6% | 7.4% | 7.2% | |
| Federal Government | 12% | 9.7% | 10.6% | 10.9% | 7.6% | -0.2% |
| Households | 28% | 9.8% | 9.7% | 10.3% | 9.6% | 8.9% |
| Nonfinancial Corporate Business | 14% | 3.3% | 2.6% | 3.5% | 0.6% | 5.0% |
| Financial Sectors | 32% | 7.8% | 8.7% | 9.8% | 9.0% | 10.8% |
| Total Credit Market Assets | 7.8% | 7.9% | 8.6% | 7.4% | 7.2% | |
| Household Sector | 6% | 8.2% | 10.8% | 14.1% | -7.0% | -4.2% |
| Rest of World | 13% | 20.7% | 18.5% | 15.9% | 16.4% | 12.6% |
| US Financial Sectors | 77% | 6.9% | 6.8% | 7.9% | 7.6% | 8.1% |
| Net Worth: Households & Nonprofit Organizations (Trillions) | $46.7 | $46.1 | $44.7 | $39.7 | $41.3 | |
| Tangible Assets | $21.7 | $20.8 | $19.9 | $18.2 | $16.8 |
by Tom Moeller December 9, 2004
Import prices increased 0.2% last month versus the Consensus expectation for no change, the gain held back by a 2.6% decline in petroleum prices. Yesterday's price for Brent crude oil of $37.52/bbl. versus the November average of $43.17 heralds another decline this month.
Non-petroleum import prices, however, rose a strong 0.7% in November. Strength reflected a 2.8% (16.0% y/y) increase in prices for industrial materials excluding petroleum, driven by a 27.5% (42.5% y/y) increase in natural gas prices.
But prices for other goods firmed as well. Capital goods prices rose 0.2% (-1.5% y/y) following several months of decline. The decline in computer prices eased to -0.1% (-6.9% y/y) and capital goods prices excluding computers rose 0.3% (+1.3% y/y). That y/y rate of increase has been roughly stable since early 2003. Non-auto consumer goods prices increased 0.1% (+0.4% y/y), the largest monthly increase since February. Motor vehicle & parts prices rose 0.2% (2.1% y/y).
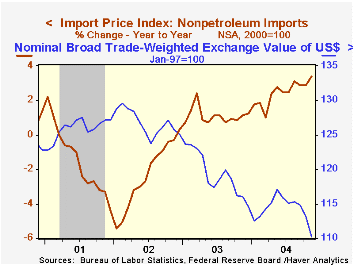
During the last fifteen years there has been a (negative) 47% correlation between the nominal broad foreign exchange value of the U.S. dollar and the y/y change in nonpetroleum import prices.
Export prices rose 0.3% as a 0.4% rise in nonagricultural prices (5.5% y/y) offset a 0.1% decline in agricultural prices (-5.2% y/y).
"Easing Out of the Bank of Japan's Monetary Easing Policy" from the Federal Reserve Bank of San Francisco is available here.
"Considering the Capital Account" from the Federal Reserve Bank of St. Louis can be found here.
| Import/Export Prices (NSA) | Nov | Oct | Y/Y | 2003 | 2002 | 2001 |
|---|---|---|---|---|---|---|
| Import - All Commodities | 0.2% | 1.6% | 9.5% | 2.9% | -2.5% | -3.5% |
| Petroleum | -2.6% | 11.6% | 60.4% | 21.0% | 3.0% | -17.2% |
| Non-petroleum | 0.7% | -0.1% | 3.4% | 1.1% | -2.4% | -1.5% |
| Export - All Commodities | 0.3% | 0.7% | 4.3% | 1.6% | -1.0% | -0.8% |
by Tom Moeller December 9, 2004
Initial unemployment insurance claims unexpectedly rose another 8,000 to 357,000 on top of the 25,000 increase during Thanksgiving week. A decline to 335,000 had been the Consensus expectation. Not seasonally adjusted, claims surged 147,300 last week.
The four week moving average of initial claims rose to 341,250 (-7.8% y/y).
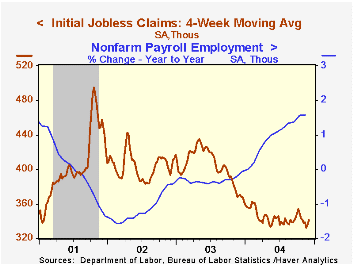
During the last ten years there has been a (negative) 82% correlation between the level of initial claims and the y/y change in payroll employment.
Continuing claims for unemployment insurance surged 91,000 following a deepened 38,000 decline the prior week.
The insured rate of unemployment ticked back up to 2.2% from a revised 2.1% the prior week.
| Unemployment Insurance (000s) | 12/04/04 | 11/27/04 | Y/Y | 2003 | 2002 | 2001 |
|---|---|---|---|---|---|---|
| Initial Claims | 357 | 349 | -5.1% | 402 | 404 | 406 |
| Continuing Claims | -- | 2,796 | -16.2% | 3,531 | 3,570 | 3,018 |

Tom Moeller
AuthorMore in Author Profile »Prior to joining Haver Analytics in 2000, Mr. Moeller worked as the Economist at Chancellor Capital Management from 1985 to 1999. There, he developed comprehensive economic forecasts and interpreted economic data for equity and fixed income portfolio managers. Also at Chancellor, Mr. Moeller worked as an equity analyst and was responsible for researching and rating companies in the economically sensitive automobile and housing industries for investment in Chancellor’s equity portfolio. Prior to joining Chancellor, Mr. Moeller was an Economist at Citibank from 1979 to 1984. He also analyzed pricing behavior in the metals industry for the Council on Wage and Price Stability in Washington, D.C. In 1999, Mr. Moeller received the award for most accurate forecast from the Forecasters' Club of New York. From 1990 to 1992 he was President of the New York Association for Business Economists. Mr. Moeller earned an M.B.A. in Finance from Fordham University, where he graduated in 1987. He holds a Bachelor of Arts in Economics from George Washington University.
More Economy in Brief


