 Global| May 22 2008
Home Prices Fell Further
by:Tom Moeller
|in:Economy in Brief
Summary
According to the Office of Federal Housing Enterprise Oversight (OFHEO), home prices in the U.S. declined by 1.7% last quarter. The seasonally adjusted drop was about as expected but it was the third consecutive quarterly decline.That [...]
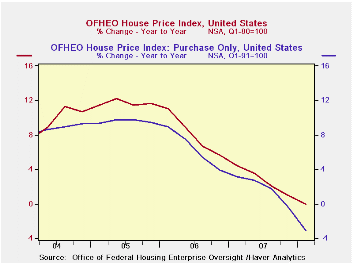
According to the Office of Federal Housing Enterprise Oversight (OFHEO), home prices in the U.S. declined by 1.7% last quarter. The seasonally adjusted drop was about as expected but it was the third consecutive quarterly decline.That drop was for mortgages for purchase only and excludes those for refinancings.
Price declines in the not seasonally adjusted figure, which includes refinancings, fell a lesser 0.2% (q/q) but the y/y indication of little change in prices represented widespread differences across the country.
Prices in California dropped 4.4% and that marked the sixth consecutive down quarter, a period during which prices fell 11.5%. Prices in Florida fell a sharp 3.3% and it was the fifth consecutive quarterly decline. Over that period prices dropped 8.2%. Home prices fell less far in New Jersey but they were still down 1.2% from the peak one year ago and in New York prices were unchanged last quarter as they have been for roughly a year.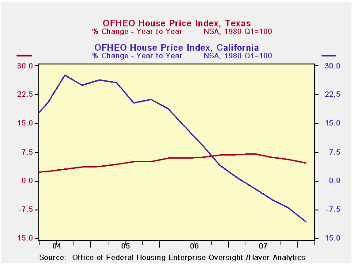
Appreciation in home prices still occurred over the last year in many areas. Prices in Texas haven't yet posted a q/q decline and the yearly gain of 4.7% is exceeded by several states, including Wyoming where prices are up 6.3% y/y. Prices also have been relatively firm in Indiana and in Arkansas, where prices rose 2.1% y/y. Wisconsin, New Jersey and Mississippi (+3.1% y/y) also showed gains in home prices during the last year.
The House Price Indices in this report are weighted indexes based on repeat sales or refinancings using data provided by Fannie Mae or Freddie Mac. The overall figures are available in Haver's USECON data base and the state figures are in the REGIONAL database.
The latest report from the Office of Federal Housing Enterprise Oversight (OFHEO) can be found here.
Falling House Prices and Rising Time on the Market from the Federal Reserve Bank of San Francisco is available here.
| House Price Index (OFHEO, %) | 1Q '08 | 4Q '07 | Y/Y | 2007 | 2006 | 2005 |
|---|---|---|---|---|---|---|
| United States (Purchase Only, SA) | -1.7 | -1.4 | -3.1 | 1.8 | 6.4 | 9.6 |
| United States (Total, NSA) | -0.2 | 0.3 | -0.0 | 2.7 | 8.0 | 11.7 |
| Texas | 0.7 | 1.1 | 4.7 | 6.4 | 6.2 | 4.6 |
| Indiana | 1.3 | 0.4 | 2.2 | 2.5 | 2.2 | 4.0 |
| Wisconsin | 0.4 | 0.9 | 1.8 | 2.8 | 4.6 | 8.2 |
| New York | 0.0 | 0.9 | 0.2 | 2.2 | 8.0 | 13.4 |
| New Jersey | -0.5 | 0.2 | -1.2 | 1.5 | 9.7 | 15.9 |
| Michigan | 0.6 | 0.1 | -3.1 | -2.7 | -0.4 | 3.8 |
| Florida | -3.3 | -1.8 | -8.1 | -0.6 | 17.1 | 25.6 |
| California | -4.4 | -2.8 | -10.6 | -3.3 | 11.3 | 23.2 |
by Tom Moeller May 22, 2008
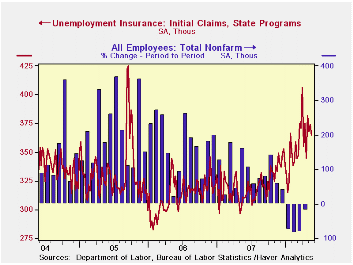
Initial claims for unemployment insurance fell a more-than-expected 9,000 last week to 365,000, reversing the prior week's little revised 6,000 rise.
The latest figure is for the week when the Bureau of Labor Statistics surveyed May nonfarm payroll employment. Claims rose 20,000 (5.8%) from the April survey period.
The four week moving average of initial claims rose week-to-week to 372,250 (22.1% y/y). Claims averaged 364,000 during April.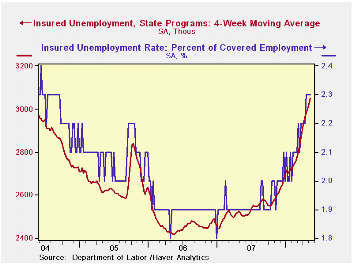
A claims level below 400,000 typically has been associated with growth in nonfarm payrolls. During the last ten years there has been a (negative) 76% correlation between the level of initial claims and the m/m change in nonfarm payroll employment.
Continuing claims for unemployment insurance were unchanged after an upwardly revised increase of 41,000 during the prior week and that increase was revised up. The latest level was the highest since March 2004. It provides some indication of workers' ability to find employment.
The figures for continuing claims lag the initial claims figures by one week.
The insured rate of unemployment held steady at 2.3% for the fourth consecutive week. That was the highest since 2004.When Motivation Means Opportunity: Training for Real Jobs from the Federal Reserve Bank of Boston can be found here.
| Unemployment Insurance (000s) | 05/17/08 | 05/10/08 | Y/Y | 2007 | 2006 | 2005 |
|---|---|---|---|---|---|---|
| Initial Claims | 365 | 374 | 17.4% | 321 | 313 | 331 |
| Continuing Claims | -- | 3,073 | 22.3% | 2,552 | 2,459 | 2,662 |

Tom Moeller
AuthorMore in Author Profile »Prior to joining Haver Analytics in 2000, Mr. Moeller worked as the Economist at Chancellor Capital Management from 1985 to 1999. There, he developed comprehensive economic forecasts and interpreted economic data for equity and fixed income portfolio managers. Also at Chancellor, Mr. Moeller worked as an equity analyst and was responsible for researching and rating companies in the economically sensitive automobile and housing industries for investment in Chancellor’s equity portfolio. Prior to joining Chancellor, Mr. Moeller was an Economist at Citibank from 1979 to 1984. He also analyzed pricing behavior in the metals industry for the Council on Wage and Price Stability in Washington, D.C. In 1999, Mr. Moeller received the award for most accurate forecast from the Forecasters' Club of New York. From 1990 to 1992 he was President of the New York Association for Business Economists. Mr. Moeller earned an M.B.A. in Finance from Fordham University, where he graduated in 1987. He holds a Bachelor of Arts in Economics from George Washington University.
More Economy in Brief


