 Global| Feb 06 2006
Gold & Oil Prices Higher Still
by:Tom Moeller
|in:Economy in Brief
Summary
Friday's gold price of $569 per ounce underscored concerns that inflationary price pressures continue to build. Since 1980 there has been a 66% correlation between the level of gold prices and the y/y change in consumer prices. Gold [...]
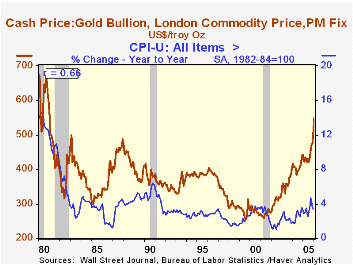
Friday's gold price of $569 per ounce underscored concerns that inflationary price pressures continue to build. Since 1980 there has been a 66% correlation between the level of gold prices and the y/y change in consumer prices. Gold prices, certainly, have been higher. In 1980 they neared $700 per ounce. But gold prices reflect and do not cause higher prices. 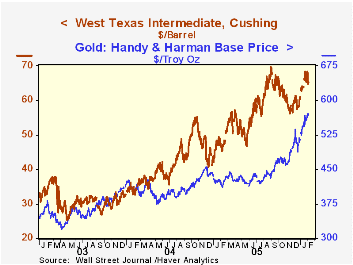
Higher oil prices fueled much of the real concern. On Friday, spot WTI crude stood at $65.38 per barrel. That was down slightly from earlier highs near $68 but prices nevertheless remained up 44% from the year ago level.
Conversely, U.S. economic pressures that might generate inflation have subsided recently. Monetary pressures certainly are down as a result of the Fed's efforts to raise interest rates. Growth in the monetary base and M2 both have decelerated to roughly 4%, a 50% deceleration from earlier rates of growth generated to combat deflation fears.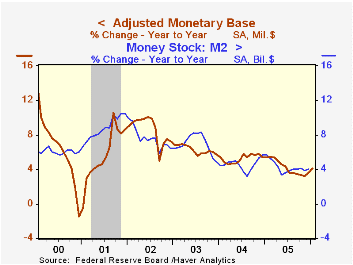
Real economic growth also has slowed. After surpassing the Congressional Budget Office's estimate of potential for just two years, U.S. GDP growth at 3.1% through 4Q05 is back down to potential. A separate calculation of the U.S. economy's potential, however, suggests that less pressure built up (see chart) when the economy was stronger.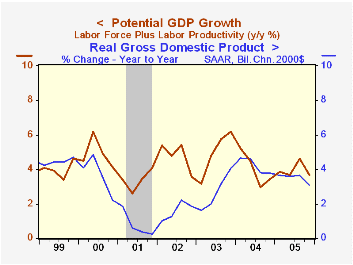
Imported inflation? With economic growth perking up abroad the question might be asked. But during the last five years growth in the major seven OECD countries has averaged a sub par 2.2%, well below the 3.0% rates of growth during the late 1990s and the 4.0% growth rates during the late 1980s. Additionally, the real value of the U.S. dollar against its major trading partners recently has strengthed.
The Long-Run Benefits of Sustained Low Inflation from the Federal Reserve Bank of St. Louis can be found here.
Energy Prices and the Economy, a 2004 article from the Federal Reserve Bank of Dallas is available here.
| Weekly Prices | 01/31/06 | 12/27/05 | Y/Y | 2005 | 2004 | 2003 |
|---|---|---|---|---|---|---|
| Light Sweet Crude Oil, WTI (per bbl.) | $67.93 | $58.16 | 44.1% | $57.59 | $41.73 | $31.00 |
| Gold: Handy & Harmon (per Troy Oz.) | $568.75 | $507.40 | 35.1% | $447.13 | $411.72 | $367.78 |
by Louise Curley February 6, 2006
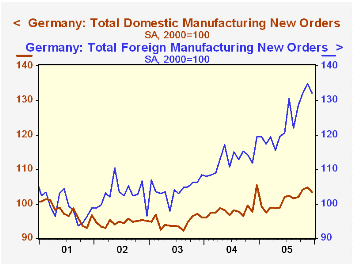
German manufacturing and mining new orders faltered in December after having risen for the three previous months. The index (2000=100) for new orders declined by 1.61% from 118.1 in November to 116.2 in December but was 4.12% above December 2004. Domestic new orders fell 1.24% while foreign new orders fell 2.00% in December from November. The data were somewhat surprising in view of the big improvement in the IFO business climate measure in January, noted last week by Carol Stone.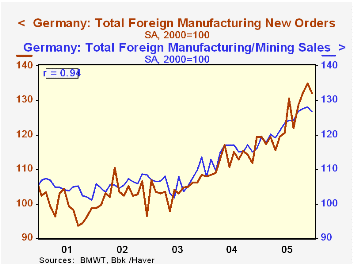 However, the business climate may have been affected more by the outlook than the immediate past. Moreover, the course of new orders has never been smooth as can be seen in the first chart that shows domestic and foreign new orders. While there is evidence of a strong upward trend in foreign new orders and a much weaker upward trend in domestic new orders, these trends have not been smooth. A one month decline has, more often than not, been followed by an increase that has raised the level of new orders above the previous peak.
Sales follow closely on new orders as can be seen in the second chart where sales and new orders are plotted. The correlation of .94 between the two series gives an R2 of .88, indicating that new orders account for .88% of the variation in sales.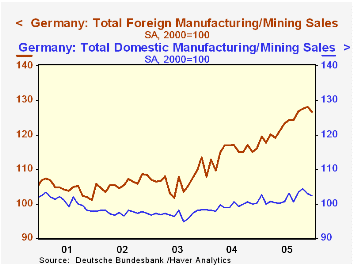
Just as foreign new orders have outpaced domestic orders foreign sales have been the dynamic area within the manufacturing and mining industries since late 2003 as shown in the third chart. The decline in the euro, starting in December 2004 has been a major factor in last year's rise. Domestic sales, on the other hand, have been hampered by a high level of unemployment and, more recently, by rising energy costs.
| Germany New Orders and Sales for Manufacturing and Mining (2000=100) | Q3 05 | Q2 05 | Q1 04 | Q/Q % | Y/Y % | 2004 | 2003 | 2002 |
|---|---|---|---|---|---|---|---|---|
| Total New Orders Nominal | 116.2 | 118.1 | 111.6 | -1.61 | 4.12 | 111.4 | 104.8 | 99.0 |
| Domestic | 103.4 | 104.7 | 105.4 | -1.24 | -1.90 | 101.1 | 98.3 | 94.6 |
| Foreign | 132.2 | 134.9 | 119.4 | -1.92 | 11.06 | 124.3 | 112.5 | 103.9 |
| Total Sales Nominal | 111.7 | 112.6 | 106.3 | -0.80 | 5.08 | 110.1 | 105.2 | 100.7 |
| Domestic | 102.4 | 103.0 | 100.2 | -0.58 | 2.20 | 101.8 | 99.4 | 96.9 |
| Foreign | 126.6 | 128.1 | 116.1 | -1.17 | 9.04 | 123.2 | 114.5 | 106.7 |
Tom Moeller
AuthorMore in Author Profile »Prior to joining Haver Analytics in 2000, Mr. Moeller worked as the Economist at Chancellor Capital Management from 1985 to 1999. There, he developed comprehensive economic forecasts and interpreted economic data for equity and fixed income portfolio managers. Also at Chancellor, Mr. Moeller worked as an equity analyst and was responsible for researching and rating companies in the economically sensitive automobile and housing industries for investment in Chancellor’s equity portfolio. Prior to joining Chancellor, Mr. Moeller was an Economist at Citibank from 1979 to 1984. He also analyzed pricing behavior in the metals industry for the Council on Wage and Price Stability in Washington, D.C. In 1999, Mr. Moeller received the award for most accurate forecast from the Forecasters' Club of New York. From 1990 to 1992 he was President of the New York Association for Business Economists. Mr. Moeller earned an M.B.A. in Finance from Fordham University, where he graduated in 1987. He holds a Bachelor of Arts in Economics from George Washington University.
More Economy in Brief
 Global| Feb 05 2026
Charts of the Week: Balanced Policy, Resilient Data and AI Narratives
by:Andrew Cates


