 Global| Oct 27 2020
Globally Money and Credit Growth Slow
Summary
Money and credit trends have become somewhat complicated. In the table below, money and credit growth broadly decelerate over three months compared to six months. But year-on-year growth compared to its 2-year pace has accelerated [...]
 Money and credit trends have become somewhat complicated. In the table below, money and credit growth broadly decelerate over three months compared to six months. But year-on-year growth compared to its 2-year pace has accelerated broadly. On monthly data as of September, EMU money growth is up, while credit growth is flat to lower. U.S. monthly growth is higher and Japan's lower. Lagged U.K. money growth is weaker and even negative.
However, setting aside the technical counting by horizon and the usual ‘artificial horizons' for inflation and other calculations (three-month, six-month, 12-month), we can find a bit more consistency in this process.
EMU money growth extends a strong pace while credit growth slows
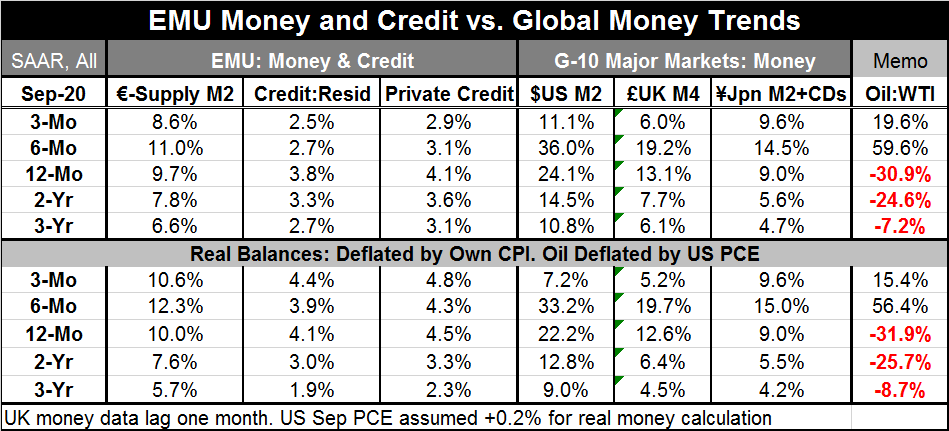
The table below looks at February-to-date compounded growth rates to assesses how money and credit growth are performing since the Covid-19 crisis largely struck its blow and policy began to react at about that time. For EMU peak growth rates are in March; for the U.S. it is the April-May period; for the U.K. it is March; and for Japan it is June. The largest monetary stimulus by far is in the U.S. (peak growth (79%), followed by the U.K. (47%), EMU (31.5%), and Japan (16%).
Japan has had the flattest performance with money growth only peaking at a pace of 16% and doing so late in June. This is despite being an Asian country that was hit quickly by the virus out of China. Compared to its peak rate of expansion, money growth in Japan has only decelerated by about 3 percentage points as of September. The EMU has seen a moderate deceleration of nearly 18 percentage points in the pace of money growth from its peak pace. The U.S. ‘leads' with a 40 percentage-point deceleration, followed by the U.K. with a 28 percentage-point deceleration. Credit growth in the EMU decelerated by 12-13 percentage points.
These patterns are neither good nor bad, but they help to pinpoint how different countries responded to the virus crisis and how well they have stayed the course. The bottom of the table chronicles the monetary stimulus in a different way by looking at the Sep/Feb growth rate compared to the growth rate in money/credit in September 2019, one year ago. On that basis, the extra monetary stimulus in the EMU, the U.K. and Japan is nearly identical at a pace inflated by 4-5 percentage points. In the U.S. the pace is inflated by a very large 14 percentage points. In the EMU, credit growth is higher by nearly one percentage point than one year ago.

In all countries, we are in the process of seeing a terrible plunging Q2 growth rate about to be followed by a stupendous Q3 growth rate. In the U.S., the two growth rates will be nearly offsetting, but that will still leave the evolution of GDP short of its previous trend by a wide margin. All countries are experiencing the same phenomenon plus a much reduced rate of growth that is expected for Q4, as monthly economic data already hint at a slower performance ahead.
In addition to the actions of monetary stimulus, there have also been fiscal moves that are not calculated or compared here. The fiscal moves have been very important because they have helped to put financial resources in the hands of economic agents directly which is a much more powerful tool than simply flooding markets with liquidity.
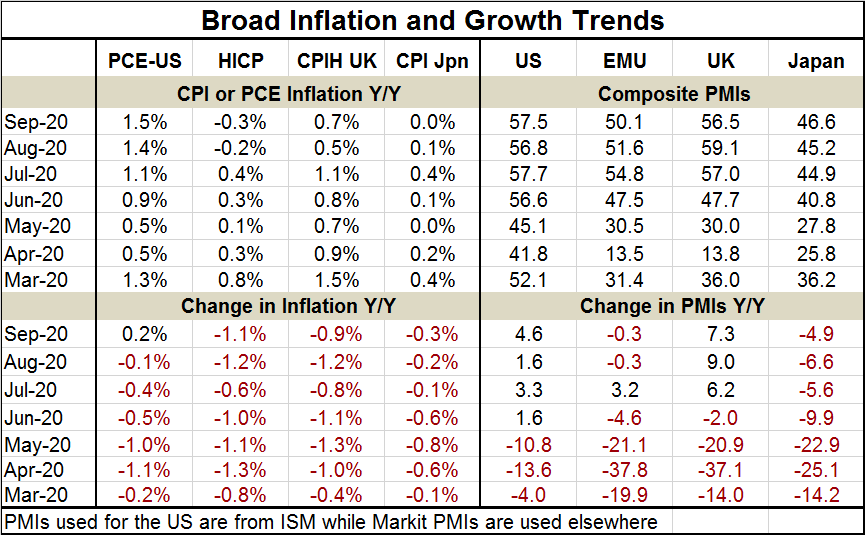
Despite all these actions, inflation remains subdued and decelerating most places. The U.S. is a minor exception to that. Meanwhile, composite PMIs show that the U.S. and the U.K. have a pick-up in year-over-year growth while the EMU and Japan still have setbacks to deal with.
Of course, PMIs are only indicators of breadth and not of growth and they have imperfections as purveyors of information on economic activity. But they are highly topical. In this case, they exaggerate the extent of the rebound since nowhere in this group is output or GDP above year-ago levels. In fact, one of the problems as we look ahead -- quite apart from trying to project GDP or IP or consumer spending (the latter that has revived most fully, at least for now) -- is that some sectors of all these economies simply have been unable to comeback because of ongoing restrictions on activity and movement meant to contain the virus.
While in some countries' spending on goods has recovered fully or nearly so, it is spending on services that has lagged. For this reason, unemployment rates are generally elevated as well or where they are not it is because of different economic systems that have kept people on the payrolls despite being under employed and in some cases perhaps not utilized at all. This difference in treatment stems from the functioning of the local economic systems.
What is clear is that monetary stimulus has been quite aggressive and while its stimulus is fading from what it was as its peak, the pace of monetary expansion- everywhere – is still in excess of what it was 12-months ago.
Similarly, countries that instituted large fiscal packages have seen the stimulus up front and now are watching its effects fade. That condition is mixing in with the next rounds of restrictions globally as Covid-19 has come back in a much –feared second wave. Countries are still in the midst of assessing the impact of this newest wave and what additional response it might require. In the U.S., the poisoned political atmosphere combined with the coming election has created an environment in which nothing has been able to get done. However, the U.S. is not alone in thinking that growth is losing momentum as we have seen comments from the Bundesbank about growth slowing down and just today by Reserve Bank of Australia Assistant Governor Michele Bullock who said Australia's economic recovery is likely to be unpredictable and uneven. So do not think that the robust round of GDP growth reports we are about to see means that we are out of the woods. We are still very much mired in the forest and will need to work our way out over some period of time depending on the virus and on the development of a vaccine. Economics always depends on the virus these days.

Robert Brusca
AuthorMore in Author Profile »Robert A. Brusca is Chief Economist of Fact and Opinion Economics, a consulting firm he founded in Manhattan. He has been an economist on Wall Street for over 25 years. He has visited central banking and large institutional clients in over 30 countries in his career as an economist. Mr. Brusca was a Divisional Research Chief at the Federal Reserve Bank of NY (Chief of the International Financial markets Division), a Fed Watcher at Irving Trust and Chief Economist at Nikko Securities International. He is widely quoted and appears in various media. Mr. Brusca holds an MA and Ph.D. in economics from Michigan State University and a BA in Economics from the University of Michigan. His research pursues his strong interests in non aligned policy economics as well as international economics. FAO Economics’ research targets investors to assist them in making better investment decisions in stocks, bonds and in a variety of international assets. The company does not manage money and has no conflicts in giving economic advice.
More Economy in Brief


