 Global| May 09 2007
German Trade Flows Dive, but Imports Dive Faster
Summary
Exports show a slowing trend while imports now show a DECLINING trend. We know that export weakness cant be for real since export orders have been filled with such life...or have they? The chart above plots the course of exports Vs [...]
Exports show a slowing trend while imports now show a DECLINING trend. We know that export weakness can’t be for real since export orders have been filled with such life...or have they?
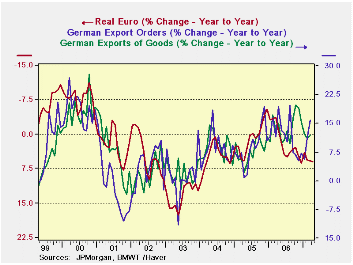
The chart above plots the course of exports Vs export orders using year/year percentage gains. The YELLOW line plots the year/year percentage change in the ‘real narrow euro FX rate’. Two things stand out. One is that the exchange rate does track pretty well the general changes in the growth rate of nominal German exports. And that trend is pointing lower. Also export orders track pretty well and note that export orders are pushing higher. What’s the message?
Obviously the message is mixed. But notice how the FX rate tracks the general direction of exports while orders track exports more closely. But also notice how orders have had a much looser relationship to exports in recent months. Indeed, since about April of 2006 export orders have fluctuated widely and have been a very poor guide for what exports themselves ultimately would do.
I remain skeptical of the predictive power of export orders, given their new unlinking from German export flows. At the same time I am impressed by the general story told by the strong Euro. I think too much emphasis is being placed on orders at a time its relationship to exports has become unstable. We shall soon be able to see if this trust in order strength will bear fruit.
| M/M% | % SAAR | ||||
| Mar-07 | Feb-07 | 3-month | 6-month | 12-month | |
| Balance* | €€ 15.54 | €€ 14.67 | €€ 15.34 | €€ 16.07 | €€ 14.32 |
| Exports | |||||
| All Export | -1.4% | 1.8% | 4.5% | 0.3% | 11.7% |
| Imports | |||||
| All Import | -3.0% | 4.1% | -2.2% | -1.6% | 6.5% |
| *Billions of Euros; monthly or period average | |||||
by Carol Stone May 9, 2007
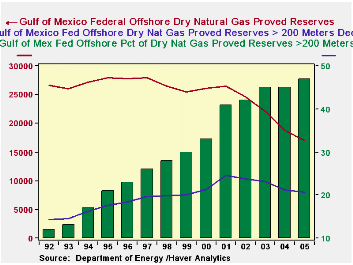
On April 30, the Department of Energy released supplementary detail on natural gas and crude oil reserves and production through 2005. Included in this report are data for "Federal Offshore Gulf of Mexico Deepwater Reserves", which Haver has just added to our OGJANN database. Over the year 2005, proved reserves of dry natural gas -- the standard "consumer grade" gas -- declined from 18.8 trillion cubic feet in the Gulf to just over 17.0 trillion or 9.6%. These reserves have fallen in eight of the 13 years for which there are data, and over the past four years, these declines have averaged 10.5%. "Proved Reserves" are the quantities that geologists and engineers deem usable -- "recoverable", in industry parlance -- in known reservoirs under existing economic and operating conditions. Obviously, recovering the gas reduces the reserves, while finding a new reservoir increases them. Notably, economic and operating conditions apply, so if prices rise, reserves might go up because the economics of production would be more favorable. Also, if drilling techniques improve, reserves could also increase, since the more efficient or highly skilled process would make it easier to reach substances in difficult locations.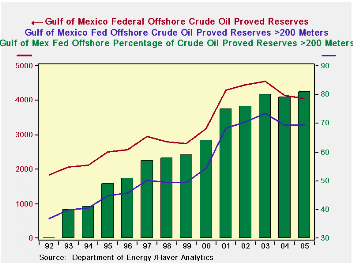
In that regard, these new series in Haver's databases also include reserves and production of gas and oil that lie more than 200 meters below the surface. So while total reserves of dry natural gas peaked in 1997 at 27.9 trillion cubic feet, reserves below 200 meters continued to increase until 2001. In 2005, even while both total and deepwater reserves were decreasing, the deepwater portion rose to 47% of the total.
Similar data exist for crude oil and for natural gas liquids in the Gulf of Mexico. Data for crude oil are shown in the table below.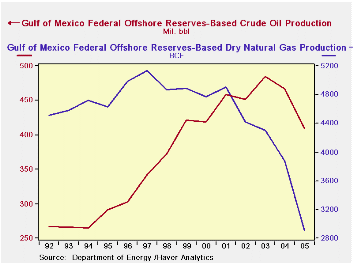
The Energy Department's information also includes the associated production data: how much is withdrawn and processed. There are technical differences between these production data and the regular monthly "marketed" concept; for natural gas, so-called flared and vented gas is included in these figures, but not in the "marketed" production.
The simple annual figures illustrate pretty clearly the impact of Hurricanes Katrina and Rita on production. Oil production in the Gulf was off 12.4% in 2005, pretty steep considering that the storms hit in late August and mid-September, two-thirds through the year. But natural gas was hit harder still, plunging almost exactly 25%. Both gas and oil produced in shallower waters were off about 30%, while deepwater natural gas had only a 12.5% decline and oil at those depths barely decreased, just 1.6%. Clearly, the deepwater reserves are crucial to the US petroleum supply in the next several years.
| 2005 | 2004 | 2003 | 2000 | 1992 | |
|---|---|---|---|---|---|
| Dry Natural Gas Proved Reserves* (Bil.cu.ft.) | 17,007 | 18,812 | 22,059 | 26,172 | 26,649 |
| Below 200 meters | 8,043 | 8,379 | 9,835 | 8,506 | 3,225 |
| Dry Natural Gas Production (Bil.cu.ft.) | 2,906 | 3,874 | 4,306 | 4,773 | 4,508 |
| Below 200 meters | 1,069 | 1,222 | 1,513 | 1,165 | 162 |
| Crude Oil Proved Reserves* (Mil. Barrels) | 4,042 | 4,144 | 4,554 | 3,174 | 1,835 |
| Below 200 meters | 3,272 | 3,280 | 3,627 | 2,021 | 557 |
| Crude Oil Production (Mil. Barrels) | 409 | 467 | 485 | 419 | 267 |
| Below 200 meters | 305 | 310 | 336 | 234 | 46 |

Robert Brusca
AuthorMore in Author Profile »Robert A. Brusca is Chief Economist of Fact and Opinion Economics, a consulting firm he founded in Manhattan. He has been an economist on Wall Street for over 25 years. He has visited central banking and large institutional clients in over 30 countries in his career as an economist. Mr. Brusca was a Divisional Research Chief at the Federal Reserve Bank of NY (Chief of the International Financial markets Division), a Fed Watcher at Irving Trust and Chief Economist at Nikko Securities International. He is widely quoted and appears in various media. Mr. Brusca holds an MA and Ph.D. in economics from Michigan State University and a BA in Economics from the University of Michigan. His research pursues his strong interests in non aligned policy economics as well as international economics. FAO Economics’ research targets investors to assist them in making better investment decisions in stocks, bonds and in a variety of international assets. The company does not manage money and has no conflicts in giving economic advice.
More Economy in Brief


