 Global| Jun 09 2009
German Orders: Big Surprise Comesin Small Package
Summary
German orders are FLAT in April: what’s so good about that? German orders have been decimated over the past year with only two month-to-month gains in the past twelve months against a slew of huge month-to-month declines. This month’s [...]

German orders are FLAT in April: what’s so good about that?
German orders have been decimated over the past year with only two
month-to-month gains in the past twelve months against a slew of huge
month-to-month declines. This month’s flat performance, however, leaves
German orders RISING early in 2009-Q2. Surprise! While February brought
a huge decline of 3.1% in orders, March took order back up by an
outsized 3.7%. The FLAT performance in April extends the March level
into 2009-Q2 imposing on Q2 a gain above the average level of orders in
2009-Q1. Optimism is born!
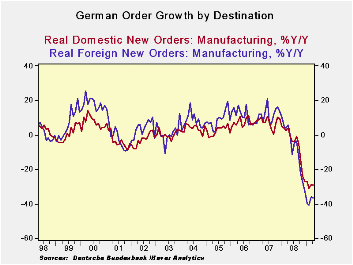
German orders are still decimated being off by 33% Yr/Yr.
Foreign order are of by 35% Yr/Yr while domestic orders are off by 29%
Yr/Yr. Foreign orders are building upward momentum again being up at an
8% pace over six months and up at an annual rate pace of 17% over three
months. Really!
Suddenly the bottom is not falling out any more...and there is
forward momentum to boot- at last somewhere. And for Germany foreign
orders are a very important ‘somewhere.’
The OECD LEIs also are giving some hint of support as they are
showing some resiliency for some OECD members. The OECD’s cyclically
adjusted leading indicator for the U.S. rose to 90.9 in April from 90.7
in March, while for Japan the index rose by the thinnest of margins to
89.5 from 89.4 in March; the leading indicator for Germany also ticked
up a to 90.3 from March's 90.2. Among the large developing economies,
China once again showed the clearest signs of revival, with its leading
indicator rising to 94.3 from 93.4. The leading indicator for India
rose in April to 93.9 from 93.5 in the previous month. Indicators for
Brazil and Russia continued to fall, which is interesting since each of
these countries is also experiencing sharp surges in their respective
equity markets. "Major non-OECD economies still face deteriorating
conditions, with the exception of China and India, where tentative
signs of a trough have also emerged," the OECD said. Still there are
lots of hints of good news in the countries that are most likely to be
leading the global business cycle. And there are even some good market
trends in countries with poor economic trends as the Brazil and Russian
stock markets show.
On balance combined with the good order results from Germany,
and stronger ‘shoots’ being seen in the US, the ‘global tea leaves’
increasingly point to some sort of global resurgence. That is not too
surprising given the floor under oil and its new rising trend.
(Although we should by now have learned to be at least somewhat
skeptical of what oil’s signal is really worth.) Still, along with
sharply improved global equity market trends that feature rising ‘high
beta’ stocks, firmer commodity price trends, and improved economic
reports, we have bond yields on the rise. For every silver lining there
is also a cloud. In the US at least attention has begun to be directed
to the prospect that rates might switch to an increasing trend even
before year end. To many this is a shock.
To be sure rising treasury rates that might boost US mortgage
rates raise questions about the sustainability of the incipient US
expansion as well. But these are the issues visited in each and every
economy that switches from recession to recovery. Beware that the
agenda in markets is changing and the US is usually a bellwether Look
for shifts in the policy discussion overseas as well once chatter over
the European elections dies down.
Things change. Sometimes they change for the better…as they
are now. And changes have consequences.
| German Orders and Sales By Sector and Origin | ||||||||
|---|---|---|---|---|---|---|---|---|
| Real and SA | % M/M | % SAAR | ||||||
| Apr-09 | Mar-09 | Feb-09 | 3-MO | 6-Mo | 12-Mo | Year Ago | QTR-2-Date | |
| Total Orders | 0.0% | 3.7% | -3.1% | 2.0% | 1.0% | -33.2% | 4.7% | 8.6% |
| Foreign | -0.5% | 5.6% | -0.9% | 17.3% | 8.3% | -36.4% | 5.4% | 18.1% |
| Domestic | 0.6% | 1.9% | -5.5% | -12.1% | -6.2% | -29.2% | 3.9% | -0.5% |
| Real Sector Sales | ||||||||
| MFG/Mining | -1.8% | 1.6% | -4.7% | -18.4% | -9.7% | -22.9% | 4.2% | -13.4% |
| Consumer | 4.4% | -0.3% | -3.3% | 2.5% | 1.2% | -6.1% | -2.0% | 19.4% |
| Consumer Durables | 0.2% | -1.4% | -7.8% | -30.9% | -16.9% | -23.1% | 3.7% | -18.9% |
| Consumer Nondurables | 5.0% | -0.1% | -2.6% | 8.9% | 4.4% | -2.9% | -2.9% | 26.3% |
| Capital Goods | -7.1% | 5.1% | -5.2% | -26.5% | -14.3% | -30.3% | 9.1% | -29.6% |
| Intermediate Goods | 1.3% | -1.1% | -3.3% | -11.9% | -6.1% | -23.1% | 3.0% | -3.3% |
| All MFG-Sales | -1.8% | 1.6% | -4.8% | -18.5% | -9.7% | -23.1% | 4.4% | -13.4% |
by Robert Brusca June 9, 2009

German industrial production fell by a sharp 1.9% m/m in
April. The April drop follows a small gain of 0.3% in March. The pace
of decline in IP is slowing down in the recent three-month period as
its negative growth rate (saar) is -18.1% compared to -32.3% over six
months. The 3-mo pace represents a slower drop than for Yr/Yr output as
well.
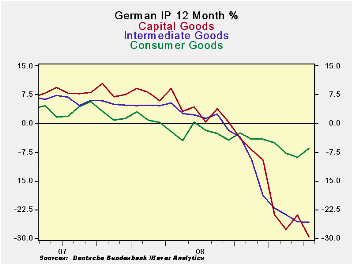
Capital goods output, the backbone of German industry,
continues to be very weak. Although capital goods output rose by a
strong 3.7% in March and that looked good at the time, the gain is now
sandwiched between declines of 5.2% m/m in February and of 6.4% m/m in
April. With the April figures in hand the March bounce looks like an
anomaly. Still, the slide in capital goods output slowed its pace of
decline in three months compared to six months returning to roughly to
its Yr/Yr pace. Intermediate goods output is where most of the progress
seems to be made. Consumer goods output is still decelerating.
German orders trends do not look as good as we had hoped.
While German orders are showing some better signs, and although output
itself rose in May, the declines are back in April and the sense of
progress is largely absent from this report.
| Total German IP | |||||||
|---|---|---|---|---|---|---|---|
| SAAR except m/m | Apr-09 | Mar-09 | Feb-09 | 3-mo | 6-mo | 12-mo | Quarter-to-Date |
| IP total | -1.9% | 0.3% | -3.4% | -18.1% | -32.3% | -21.6% | -15.5% |
| Consumer Goods | 0.5% | -1.0% | -3.7% | -15.8% | -11.6% | -6.4% | -8.4% |
| Capital Goods | -6.4% | 3.7% | -5.2% | -28.4% | -44.1% | -29.7% | -30.3% |
| Intermediate Goods | -1.0% | -1.7% | -1.3% | -14.8% | -38.1% | -25.8% | -14.4% |
| Memo | |||||||
| Construction | 0.5% | 6.0% | 1.9% | 39.1% | 13.9% | 6.6% | 35.1% |
| MFG IP | -2.9% | 0.8% | -3.5% | -20.5% | -36.8% | -24.2% | -19.4% |
| MFG Orders | 0.0% | 3.7% | -3.1% | 2.0% | -34.7% | -33.2% | 8.6% |
by Louise Curley June 09, 2009

A diverse group of European countries--Czech Republic, Cyprus,
Estonia, Finland, Malta and Portugal--reported their first quarter GDPs
today. Cyprus, the second smallest country in terms of population in
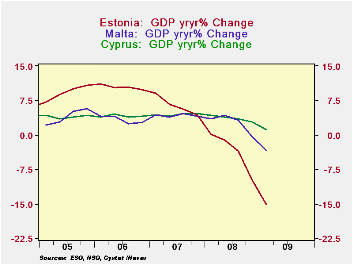
the Euro Area, was one of those rare countries to report an increase in
GDP of 1.2% in the first quarter of 2009 over the first quarter of
2008. Malta, the smallest country in the Euro Area, in terms of
population, reported a year to year decline of 3.4%. Estonia, another
relatively small country, in terms of population, reported a year to
year decline of 15.1% in the first quarter of this year after a 9.7%
year to year decline in the fourth quarter. Estonia is the last of the
Baltic's to report its first quarter GDP. Lithuania earlier reported a
13.6% year over year decline and Latvia, one of 18%. The first chart
shows the year to year changes in GDP for Cyprus, Malta and Estonia.
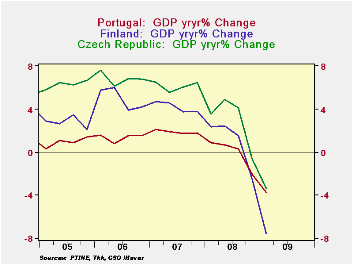
Among the mid sized countries--population wise-- reporting today, the Czech Republic reported a first quarter year to year declines in GDP of 3.4% after a 0.6% decline in the fourth quarter of last year. Portugal's year to year decline in the first quarter of 3.7% followed a 2.0% decline in the fourth quarter of last year. Finland's year to year decline at 7.5% was more than twice those of the Czech Republic and Portugal. The second chart shows the year to year changes in GDP for the Czech Republic, Finland and Portugal.
| Y/Y Change in GDP | Q1 09 | Q4 08 | Q3 08 | Q2 08 | Q1 08 | Population (000) |
|---|---|---|---|---|---|---|
| Czech Republic | -3.35 | -0.59 | 4.12 | 4.91 | 3.51 | 10,475 |
| Finland | -7.52 | -2.41 | 1.54 | 2.46 | 2.37 | 5,245 |
| Portugal | -3.70 | -2.01 | 0.30 | 0.69 | 0.85 | 10,632 |
| Cyprus | 1.16 | 2.78 | 3.45 | 3.85 | 4.26 | 793 |
| Estonia | -15.07 | -9.69 | -3.54 | -1.11 | 0.19 | 1,307 |
| Malta | -3.35 | -0.28 | 3.10 | 4.15 | 3.41 | 404 |
Robert Brusca
AuthorMore in Author Profile »Robert A. Brusca is Chief Economist of Fact and Opinion Economics, a consulting firm he founded in Manhattan. He has been an economist on Wall Street for over 25 years. He has visited central banking and large institutional clients in over 30 countries in his career as an economist. Mr. Brusca was a Divisional Research Chief at the Federal Reserve Bank of NY (Chief of the International Financial markets Division), a Fed Watcher at Irving Trust and Chief Economist at Nikko Securities International. He is widely quoted and appears in various media. Mr. Brusca holds an MA and Ph.D. in economics from Michigan State University and a BA in Economics from the University of Michigan. His research pursues his strong interests in non aligned policy economics as well as international economics. FAO Economics’ research targets investors to assist them in making better investment decisions in stocks, bonds and in a variety of international assets. The company does not manage money and has no conflicts in giving economic advice.
More Economy in Brief
 Global| Feb 05 2026
Charts of the Week: Balanced Policy, Resilient Data and AI Narratives
by:Andrew Cates


