 Global| Oct 08 2019
German IP Has Upside Surprise But With Little Impact
Summary
A monthly rebound, yes, but NO green shoots The August 0.3% rebound in German IP and the stronger rebound of 0.7% in German manufacturing IP are surprises that were not tipped off by German orders or by the German PMI or by other [...]
 A monthly rebound, yes, but NO green shoots
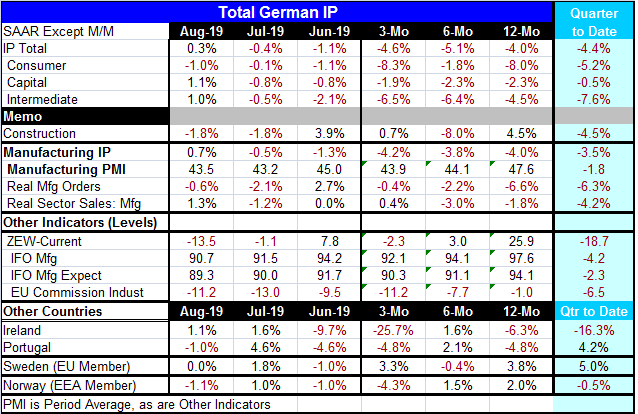
The August 0.3% rebound in German IP and the stronger rebound of 0.7% in German manufacturing IP are surprises that were not tipped off by German orders or by the German PMI or by other indicators we already have in hand. However, even the manufacturing rebound looks like it is too little too late to avoid a decline in IP in Q3. Of course, that depends entirely on what happens in September and if there is any significant revision to August. But there is no reason to think that will happen. On the face of these numbers, IP would need some substantial growth in September to wipe out the current weakness. IP is declining as of August on all horizons and for all sectors. Growth rates are sequentially deteriorating only for intermediate goods. But the weakness in capital goods is steady and relentless at about a -2% rate of growth. Consumer goods output is deeply negative with growth rates of -8% over 12 months and -8.3% over three months. Despite the headline gain in August, IP is weak. Even with its ‘substantial’ rebound of 0.7% in August, manufacturing IP declines on all three horizons and it carries a consistent negative growth rate of -4% or so on each horizon. So much for optimism. Volatility is not optimism. However, volatility after unrelenting weakness, may be a sign that the weakening trend is about to change and maybe moderate – I will grant that. Note the chart, for example. But note also that manufacturing has made other retracings that subsequently gave way to ongoing weakness.
Q3 IP in the spotlight
Turning to Q3 more specifically, the quarter-to-date (QTD) column shows declines for IP all its sectors and for all industrial measures in the table. The QTD for IP calculates growth from the fixed base off the previous quarter as new data come in; this is UNLIKE the sequential growth rates whose period shifts and the base of the calculations shifts for three-month, six-month and 12-month growth rates each month. The QTD data are to assess momentum relative to Q2 which is what will happen when Q3 data are complete. The QTD growth rate does this without extrapolating any data. It simply positions the current up-to-date data relative to Q2 and presents the growth rate. With two months data in hand, the Q3 result is now two-thirds complete. Q2 centers on May and Q3 will, of course, center on August. But the average of August and July data imply that Germany is only 2.5 months into the new quarter since July-August is an average; we do not calculate this from August but from the average calendar position which properly positions and ‘centers’ the July-August data. All QTD IP data are calculated on this conceptual framework. As such, IP is falling at a 4.4% pace in Q3 with manufacturing output falling at a lesser 3.5% pace. Consumer goods output is off at a 5.2% pace while capital goods is barely declining after its 1.1% gain in August. Intermediate goods output also spiked by 1% in August, but its QTD pace is still extremely weak at a -7.6% annual rate.
Indicators in Q3
The indicators are complete in Q3. So their QTD calculations are simpler and are for a completed quarter. I do not annualize them because they are indicators and we understand them as index levels and as diffusion readings as much as anything. So the QTD column for the indicators is the simple difference in the Q3 vs. the Q2 quarterly averages. We have PMI data for September as well as ZEW, IFO and EU Commission surveys. The tabular calculations for QTD are presented based on September values for these indicators, not for the data through August that are presented in the table that still ‘line up with’ the IP data. There is some reason to look at the indicator reports both ways. So the data in the table present parallel time readings for IP and indicators for all columns except the QTD where we incorporate the fresh September readings for the indicators for the true quarter not just ‘QTD’. Since these indicators continue to weaken, it is unlikely that the September IP will be rebounding enough to create a positive IP signature in Q3. The quarter-to-quarter changes in the manufacturing PMI and other indicators are a strong sign of ongoing weakness. These surveys flag the unexpected monthly IP gain as essentially a rogue wave of strength. The orders and sales data in the table are treated the same as the IP data and they are up-to-date only though August and, like IP, they are accounting data from which we can calculate growth rates for the surveyed concept. They are not diffusion metrics. These reports echo the view of ongoing weakness.
IP and other Europe
Few other European countries have reported IP this early. We present that rag-tag group at the table bottom. For the four reporters in August, only one has an output gain, one is dead flat and two show declines. Three of four show declines over three months. Only Sweden shows an IP decline over six months. But the two EMU members Ireland and Portugal decline on balance over 12 months while Sweden and Norway post solid gains. Quarter-to-date, the sample is split with two showing IP declines and two showing gains in Q3.
Summing up
The trend in manufacturing is quite clear. The survey data reinforce our view of weakness. IP can and will be erratic month-to-month; this month’s rebound should not be oversold as strength. There are no ‘green shoots’ evident in this report.

Robert Brusca
AuthorMore in Author Profile »Robert A. Brusca is Chief Economist of Fact and Opinion Economics, a consulting firm he founded in Manhattan. He has been an economist on Wall Street for over 25 years. He has visited central banking and large institutional clients in over 30 countries in his career as an economist. Mr. Brusca was a Divisional Research Chief at the Federal Reserve Bank of NY (Chief of the International Financial markets Division), a Fed Watcher at Irving Trust and Chief Economist at Nikko Securities International. He is widely quoted and appears in various media. Mr. Brusca holds an MA and Ph.D. in economics from Michigan State University and a BA in Economics from the University of Michigan. His research pursues his strong interests in non aligned policy economics as well as international economics. FAO Economics’ research targets investors to assist them in making better investment decisions in stocks, bonds and in a variety of international assets. The company does not manage money and has no conflicts in giving economic advice.
More Economy in Brief


