 Global| May 03 2005
FOMC Lifts Funds Rate to 3.00%
by:Tom Moeller
|in:Economy in Brief
Summary
The Federal Open Market Committee raised the target rate for federal funds an expected 25 basis points to 3.00%. The discount rate also was raised 25 basis points to 4.00%. The unanimous decision to raise rates was the eighth since [...]
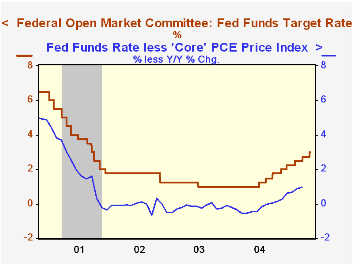
The Federal Open Market Committee raised the target rate for federal funds an expected 25 basis points to 3.00%. The discount rate also was raised 25 basis points to 4.00%.
The unanimous decision to raise rates was the eighth since last June.
Today's press release from the Fed continued to contain a comment suggesting that rates could be raised again. "The Committee believes that, even after this action, the stance of monetary policy remains accommodative ..." The text also continued to mention that "the Committee believes that policy accommodation can be removed at a pace that is likely to be measured."
In a more forthright comment on inflation than made in the past, the press release indicated "Pressures on inflation have picked up in recent months and pricing power is more evident."
For the complete text of the Fed's latest press release please click here.
U.S. Monetary Policy: An Introduction from the Federal Reserve Bank of San Francisco can be found here.
Challenger Layoff Count Lowest Since 2000by Tom Moeller May 3, 2005
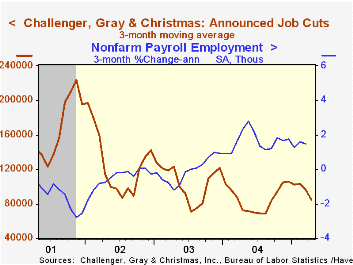
Challenger, Gray & Christmas reported that job cut announcements in April fell 33.0% to the lowest level since November 2000. The three month average of job cut announcements fell to the lowest level since last September.
During the last ten years there has been an 84% (inverse) correlation between the three month moving average of announced job cuts and the three month change payroll employment.
Job cut announcements fell sharply m/m in the consumer goods (-18.2% y/y), industrial goods (-27.1% y/y), telecommunication (-96.1% y/y) and transportation industries but declines elsewhere were limited.
Job cut announcements differ from layoffs. Many are achieved through attrition, early retirement or just never occur.
Challenger also reported that announced hiring plans recovered some of the prior month's decline with a 21.3% rise.
| Challenger, Gray & Christmas | April | Mar | Y/Y | 2004 | 2003 | 2002 |
|---|---|---|---|---|---|---|
| Announced Job Cuts | 57,861 | 86,396 | -19.8% | 1,039,175 | 1,236,426 | 1,431,052 |
by Tom Moeller May 3, 2005
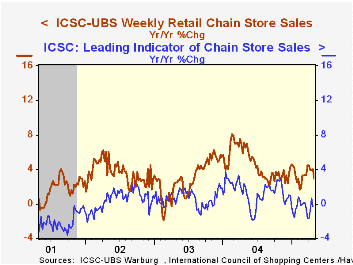
Chain store sales gained 0.5% during the final week of April according to the International Council of Shopping Centers (ICSC)-UBS survey. The increase raised the average of sales in April 0.4% versus March when sales fell 0.2%.
During the last ten years there has been a 56% correlation between the y/y change in chain store sales and the change in non-auto retail sales less gasoline, as published by the US Census Department. Chain store sales correspond directly with roughly 14% of non-auto retail sales less gasoline.
The leading indicator of chain store sales from ICSC ticked 0.1% (-0.3% y/y) higher, the third consecutive weekly rise following three declines.
The ICSC-UBS retail chain-store sales index is constructed using the same-store sales (stores open for one year) reported by 78 stores of seven retailers: Dayton Hudson, Federated, Kmart, May, J.C. Penney, Sears and Wal-Mart.
Reexamining the Consumption-Wealth Relationship: The Role of Uncertainty from the Federal Reserve Bank of New York can be found here.
| ICSC-UBS (SA, 1977=100) | 04/30/05 | 04/23/05 | Y/Y | 2004 | 2003 | 2002 |
|---|---|---|---|---|---|---|
| Total Weekly Chain Store Sales | 458.0 | 455.8 | 3.0% | 4.6% | 2.9% | 3.6% |
by Tom Moeller May 3, 2005
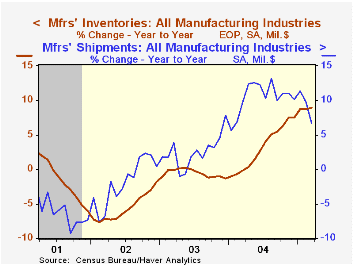
Factory inventories rose 0.6% in March following an upwardly revised like increase in February. Higher oil prices recently have lifted these gains, but not a lot, as petroleum refinery inventories rose 3.2% (22.4% y/y). Less petroleum, inventories rose 0.5% (8.4% y/y).
Accumulation in the primary metals industry has been notable, up 30.3% y/y, and fabricated metal inventories also rose a strong 17.3% y/y. Machinery inventorieshave risen 11.1% this past year and electrical equipment inventories are up 7.9%. Inventories of furniture & related products rose 12.2% y/y while inventories of apparel rose 7.5% y/y.
Factory shipments recovered nearly all of the prior month's drop with a 1.3% gain. Less transportation, shipments rose 1.6% (9.2% y/y) following a deepened 1.2% decline in February.
Orders to the factory sector ticked up 0.1%, restrained by a 2.3% decline in durable goods orders which was revised from the advance report of a 2.8% drop. The decline in orders for non-defense capital goods less aircraft was lessened to 4.0% (+2.7% y/y) from the advance report of a 4.7% shortfall.Nondurable goods orders, which equal shipments, rose 2.8% (10.4% y/y) led by a 19.8% (42.2% y/y) surge in petroleum. Less oil, orders for non-durables fell 0.4% (+5.5% y/y) for the second monthly drop.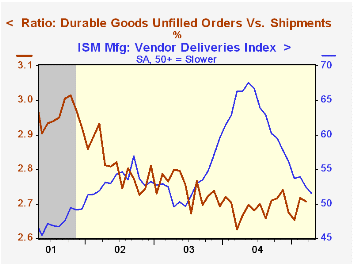
Unfilled orders fell 0.3% and lowered the ratio of unfilled orders to shipments for durables slightly.
Do Technological Improvements in the Manufacturing Sector Raise or Lower Employment? from the Federal Reserve Bank of Philadelphia can be found here.
| Factory Survey (NAICS) | Mar | Feb | Y/Y | 2004 | 2003 | 2002 |
|---|---|---|---|---|---|---|
| Inventories | 0.6% | 0.6% | 8.9% | 7.5% | -1.3% | -1.8% |
| New Orders | 0.1% | -0.5% | 4.1% | 10.9% | 3.7% | -1.9% |
| Shipments | 1.3% | -1.5% | 6.7% | 10.5% | 2.6% | -2.0% |
| Unfilled Orders | -0.3% | 0.5% | 6.8% | 9.1% | 4.2% | -6.1% |
by Louise Curley May 3, 2005
The Confederation of British Industries' (CBI's) Distributive Trades Survey released today, shows a weakening in current retail trade volume and in expected volumes. The percent balance between those who reported an increase in volume in April and those who report a decrease was -14%, compared with -9% in March and +30% in April, 2004.
In the March Survey, there were 3% more retailers who expected an increase in volume in April than those who expected a decrease. In the current survey, there are only 1% more retailers who expect an increase in volume than those who expect a decrease in May suggesting that retailers are almost equally balanced between those who expect May volume will increase and those who expect it to decrease.
Survey results for the wholesale trade sector were more positive. The balance of those reporting an increase in volume over those reporting a decrease rose to 2% from -17% in March in contrast to the expectations expressed in the March Survey when the balance in April was expected to be -7%. The current Survey expects that the balance of increases in wholesale volume over decreases will rise to16% in May.
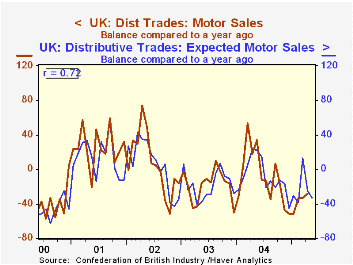
Reported current and expected volumes in the Motor Trades are bleak. Although the balance of those reporting a decrease in volume over those reporting an increase improved in April to -28%, from -33%, in March, it was 46 percentage points below the +18% of April, 2004. In the March Survey, the expectation for motor trade volume was for a balance of -25%, not too different from the actual figure reported for April. In the current survey, the expectation is that balance of those expecting an increase over those expecting a decrease will increase still further to -33%.
The ability of the expected series to forecast subsequently reported balances is not particularly robust as measured by the correlation coefficient. The best, shown in the attached chart, is that for the motor trades, which has a correlation coefficient of 0.72, compared with that for retail trade of .53 and for wholesale trade, .27. The fact that the motor trades sector is relatively homogeneous while those of the retail and wholesale sectors are heterogeneous may account for better ability of expectations in the motor trades to predict the subsequently reported volume.
| UK: Distributive Trade Survey | Apr 05 | Mar 05 | Apr 04 | M/M dif | Y/Y dif | 2004 | 2003 | 2002 |
|---|---|---|---|---|---|---|---|---|
| Reported (Percent Balance) |
||||||||
| Retail Trade | -14 | -9 | 30 | -5 | -44 | 24 | 14 | 23 |
| Wholesale Trade | 2 | -17 | 38 | 19 | -36 | 27 | 4 | 6 |
| Motor Trade | -28 | -33 | 18 | 5 | -46 | -8 | -19 | 7 |
| May 05 | Apr 05 | May 04 | M/M dif | Y/Y dif | 2004 | 2003 | 2002 | |
| Expected (Percent Balance) |
||||||||
| Retail Trade | 1 | 3 | 34 | -2 | -34 | 25 | 18 | 29 |
| Wholesale Trade | 16 | -7 | 32 | 22 | -16 | 17 | -1 | 1 |
| Motor Trade | -33 | -25 | 22 | -8 | -55 | -8 | -18 | 5 |

Tom Moeller
AuthorMore in Author Profile »Prior to joining Haver Analytics in 2000, Mr. Moeller worked as the Economist at Chancellor Capital Management from 1985 to 1999. There, he developed comprehensive economic forecasts and interpreted economic data for equity and fixed income portfolio managers. Also at Chancellor, Mr. Moeller worked as an equity analyst and was responsible for researching and rating companies in the economically sensitive automobile and housing industries for investment in Chancellor’s equity portfolio. Prior to joining Chancellor, Mr. Moeller was an Economist at Citibank from 1979 to 1984. He also analyzed pricing behavior in the metals industry for the Council on Wage and Price Stability in Washington, D.C. In 1999, Mr. Moeller received the award for most accurate forecast from the Forecasters' Club of New York. From 1990 to 1992 he was President of the New York Association for Business Economists. Mr. Moeller earned an M.B.A. in Finance from Fordham University, where he graduated in 1987. He holds a Bachelor of Arts in Economics from George Washington University.
More Economy in Brief


