 Global| Sep 22 2009
FHFA Home Price Index Strengthens Due To Notable Gains In The Pacific & Mid-Atlantic Regions
by:Tom Moeller
|in:Economy in Brief
Summary
Released yesterday was the U.S. House Price Index from the Federal Housing and Finance Agency (FHFA). The Purchase Only Index for July rose 0.3% from June and it was the third consecutive monthly increase. Moreover, the latest gain [...]
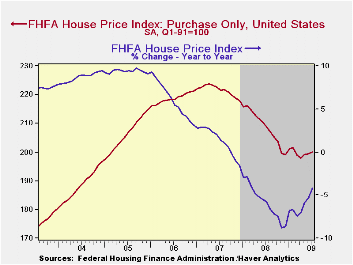
Released yesterday was the U.S. House Price Index from the
Federal Housing and Finance Agency (FHFA). The Purchase Only Index for
July rose 0.3% from June and it was the third consecutive monthly
increase. Moreover, the latest gain eased the year-to-year decline in
the nationwide average of home prices to 4.2% from its worst reading of
negative 8.9% last November. Since their peak in early-2007 home prices
nationwide have fallen 10.5%. The FHFA uses data provided by Fannie Mae
and Freddie Mac and it is not value-weighted.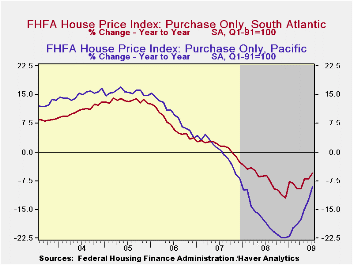
Most notable during July was the 1.6% gain in home prices in the Pacific region of the country. It followed similarly strong 0.7% and 1.6% increases during the prior two months. Nevertheless these increases follow earlier home price declines that were amongst the sharpest in the country. Versus last July prices in the region were still down 9.0% after having fallen 17.3% during all of 2008. Recent improvement in home prices also was evident in a 1.0% July increase in the Mid-Atlantic region. That gain, however, only recouped the decline during June and left prices roughly even with the year-end 2008 level. More moderate monthly gain in home prices were logged in the West North Central, South Atlantic and Mountain Regions of the country. In the latter two regions, however, prices continued notably below the year-ago level.
Continuing weak were home prices in several of the country's regions. Despite a 0.3% July increase, prices in the Mountain states remained off 9.8% from the year ago level and they were off 16.1% from the 2007 peak. In the South Atlantic region prices also posted a gain during July but the 0.6% uptick still left them off by 5.6% from one year ago. Since their early-2007 peak prices here have fallen 12.8%. In the populous East North Central region prices slipped another 0.3% during July and they were flat year-to-date.
Cross-Country Causes and Consequences of the 2008 Crisis: Early Warning Signals from the Federal Reserve Bank of San Francisco can be found here.
| FHFA U.S. House Price Index Purchase Only (%) | July | June | Y/Y | 2008 | 2007 | 2006 |
|---|---|---|---|---|---|---|
| Total | 0.3 | 0.1 | -4.2 | -5.8 | 1.3 | 6.0 |
| New England | -0.1 | 0.3 | -2.5 | -4.6 | -1.7 | 1.1 |
| Middle Atlantic | 1.0 | -1.1 | -2.9 | -2.3 | 1.9 | 6.3 |
| East North Central | -0.3 | -0.2 | -3.3 | -4.4 | -1.3 | 1.8 |
| West North Central | 0.3 | -0.3 | -1.5 | -2.8 | 1.0 | 3.2 |
| South Atlantic | 0.6 | -0.2 | -5.6 | -7.1 | 1.4 | 7.1 |
| East South Central | -0.9 | 2.3 | -1.7 | -1.4 | 3.8 | 7.2 |
| West South Central | -0.2 | 1.1 | 0.1 | 0.7 | 4.7 | 7.2 |
| Mountain | 0.3 | -1.0 | -9.8 | -6.0 | 4.0 | 10.6 |
| Pacific | 1.6 | 0.7 | -9.0 | -17.3 | 0.1 | 9.8 |
Weekly Chain Store Sales Trend Lower During September
by Tom Moeller September 22, 2009
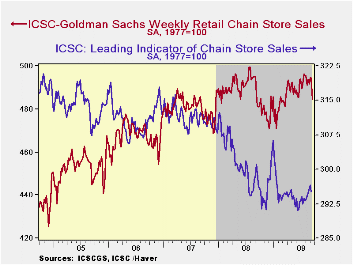
Encouraging indications that consumer spending was improving faded further during September. During the latest week, chain store sales fell 2.0% and that was enough to pull sales for the month so far to their lowest level since June.
During the last ten years there has been a 69% correlation between the year-to-year growth in chain store sales and the growth in general merchandise sales. The weekly figures are available in Haver's SURVEYW database.
The ICSC-Goldman Sachs retail chain-store sales index is constructed using the same-store sales (stores open for one year) reported by 78 stores of seven retailers: Dayton Hudson, Federated, Kmart, May, J.C. Penney, Sears and Wal-Mart.
Prospects for improvement in sales seem limited. The leading
indicator of sales slipped 0.5% (-2.0% y/y) during the latest week
though it had risen somewhat earlier this summer.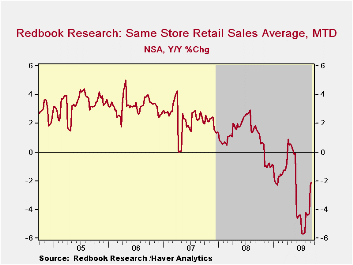
The Johnson Redbook also reported soft sales of late. General merchandise store sales so far this month increased a seasonally adjusted 0.4% from August (-2.1% y/y) following three months of sometimes sharp decline. Department store sales were down 4.8% y/y on a same-store basis while discount store sales slipped just 0.2% as shoppers searched for bargains.
The Dynamics of Automobile Expenditures from the Federal Reserve Bank of New York is available here
| ICSC-UBS (SA, 1977=100) | 09/19/09 | 09/12/09 | Y/Y | 2008 | 2007 | 2006 |
|---|---|---|---|---|---|---|
| Total Weekly Chain Store Sales | 484.6 | 494.5 | 0.6% | 1.4% | 2.8% | 3.3% |
Canadian Retail Sales Are Digging Out Slowly
by Robert Brusca September 22, 2009
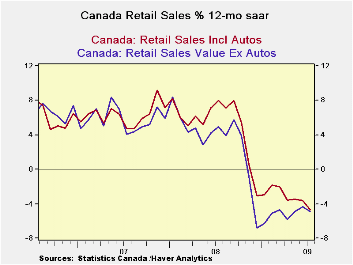
Retail sales in Canada fell by 0.6% in July following a surge
in growth of 1% in June and of 1.1% in May. In the new quarter retail
sales are expanding at a 3% pace in nominal terms. For the quarter
supermarket sales are dropping. Sales of new car dealers are surging in
double digits. Clothing sales are up at a 3.4% nominal pace. Excluding
autos the annual rate gain early in Q3 are 0.9%.
More broadly, sales trends show gains that are gathering pace
over three-months and mixed to the positive side over six months.
Overall sales are expanding at a rate of 6.4% over three months at a
pace of 3.6% excluding autos and at a 6.4% pace for overall sales.
The chart shows how Canada’s retail sales simply fell off a
cliff at the end of 2008 when the US economy’s financial crisis took
hold. Since then ex-auto sales are showing a more consistent rebound.
Overall sales have only really reduced their rate of decline and the
trend drop still seems to be operative for year-over year calculations.
However over that short spans memorialized in the table both overall
and ex-auto sales are hosing that progress is in train.
| Canada Retail Sales | ||||||||
|---|---|---|---|---|---|---|---|---|
| Mo/Mo | Saar | New QTR | ||||||
| Nominal % | Jul-09 | Jun-09 | May-09 | 3-Mo | 6-Mo | 12-MO | Yr-Ago | Saar |
| Total RTL | -0.6% | 1.0% | 1.1% | 6.4% | 2.5% | -4.9% | 5.0% | 3.0% |
| New Car Dealerss | 0.2% | 0.5% | 3.5% | 18.0% | 15.1% | -6.6% | -5.8% | 10.5% |
| Supermarkets | -1.6% | 0.8% | -0.2% | -3.9% | -2.5% | 4.3% | 3.1% | -6.6% |
| Clothing Stores | 0.1% | 0.5% | 0.3% | 3.8% | -2.1% | -4.1% | 2.4% | 3.4% |
| Retail less MVs | -0.8% | 1.1% | 0.6% | 3.6% | 0.2% | -4.7% | 7.9% | 0.9% |
Unemployment In Ireland, Italy, Finland, And Taiwan
by Louise Curley September 22, 2009
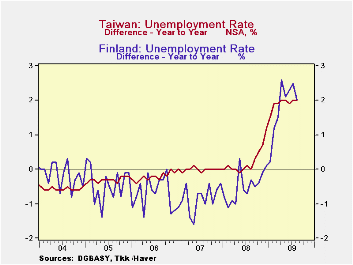
Quarterly unemployment data for the second quarter for Ireland
and Italy, and monthly data for August for Finland and Taiwan were
released today. The attached two charts show the year over year changes
in the unemployment rates for the four countries: monthly data for
Finland and Taiwan and quarterly data for Ireland and Italy. Ireland
has the highest rate of unemployment, 12%, of the four countries and
the largest increase, 6.3 percentage points, over the same period of a
year ago. The other three countries show year over year increases of
2.6 percentage points or less. The big rise in unemployment in Ireland
is another indicator of the severity of the recession hitting that
country.
The rise in unemployment in Ireland has undoubtedly played a part in the dramatic change in its net migration. The Irish Central Statistics Office reported today that in the year ending April, 2009, emigrants exceeded immigrants by 7,800, compared with an excess of immigrants of 38,500 in the previous year. This was the first excess of emigrants since 1995. Ireland's long history of net emigration, was reversed beginning in 1996 and continued through 2008 as the economy prospered. Net migration reached a high of 71,800 in 2006 at the height of the economic boom.
| Unemployment Rates (NAS %) | Q2 09 | Q1 09 | Q4 09 | Q3 08 | Q2 08 | Q1 08 | Q4 07 | Q3 07 |
|---|---|---|---|---|---|---|---|---|
| Ireland | 12.0 | 10.2 | 7.6 | 7.0 | 5.7 | 4.9 | 4.5 | 4.6 |
| Italy | 7.4 | 7.9 | 7.1 | 6.1 | 6.7 | 7.1 | 6.6 | 5.6 |
| Aug 09 | Jul 09 | Jun 09 | May 09 | Apr 09 | Mar 09 | Feb 09 | Jan 09 | |
| Finland | 7.6 | 7.7 | 9.1 | 10.9 | 8.8 | 8.3 | 7.6 | 7.0 |
| Taiwan | 6.1 | 6.1 | 5.9 | 5.8 | 5.8 | 5.8 | 5.8 | 5.3 |

Tom Moeller
AuthorMore in Author Profile »Prior to joining Haver Analytics in 2000, Mr. Moeller worked as the Economist at Chancellor Capital Management from 1985 to 1999. There, he developed comprehensive economic forecasts and interpreted economic data for equity and fixed income portfolio managers. Also at Chancellor, Mr. Moeller worked as an equity analyst and was responsible for researching and rating companies in the economically sensitive automobile and housing industries for investment in Chancellor’s equity portfolio. Prior to joining Chancellor, Mr. Moeller was an Economist at Citibank from 1979 to 1984. He also analyzed pricing behavior in the metals industry for the Council on Wage and Price Stability in Washington, D.C. In 1999, Mr. Moeller received the award for most accurate forecast from the Forecasters' Club of New York. From 1990 to 1992 he was President of the New York Association for Business Economists. Mr. Moeller earned an M.B.A. in Finance from Fordham University, where he graduated in 1987. He holds a Bachelor of Arts in Economics from George Washington University.
More Economy in Brief


