 Global| Dec 22 2009
FHFA Home Price Index Improves Slightly M/M But Greatly Y/Y
by:Tom Moeller
|in:Economy in Brief
Summary
Improvement in housing prices continued this fall according the U.S. House Price Index from the Federal Housing and Finance Agency (FHFA). The Purchase Only Index for October rose 0.6% and reversed its September. Nevertheless, the [...]
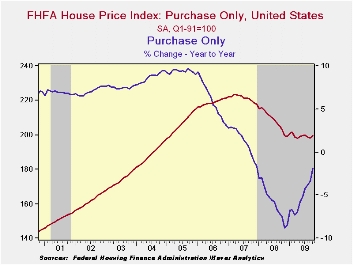
Improvement in housing prices continued this fall according the U.S. House Price Index from the Federal Housing and Finance Agency (FHFA). The Purchase Only Index for October rose 0.6% and reversed its September. Nevertheless, the year-to-year decline in the nationwide average of home prices eased to -1.9% from its worst reading of -8.8% last November. Since their peak in early-2007 home prices nationwide have fallen 10.7%. The FHFA uses data provided by Fannie Mae and Freddie Mac and is not value-weighted.
 The HPI is calculated using a repeat sales index. That means
that the HPI measures changes in the price of the same property over
time but does not measure changes in property types over time. So if,
for example, the price of a larger, new home was not growing very
rapidly, but the number of people transitioning from smaller homes to
larger homes greatly increased, median house prices would go up (people
buying more expensive houses) much more than the HPI. In this way, the
HPI is a better measure of how any particular home is appreciating
while the median house price is a better measure of what the typical
home buyer is paying.
The HPI is calculated using a repeat sales index. That means
that the HPI measures changes in the price of the same property over
time but does not measure changes in property types over time. So if,
for example, the price of a larger, new home was not growing very
rapidly, but the number of people transitioning from smaller homes to
larger homes greatly increased, median house prices would go up (people
buying more expensive houses) much more than the HPI. In this way, the
HPI is a better measure of how any particular home is appreciating
while the median house price is a better measure of what the typical
home buyer is paying.
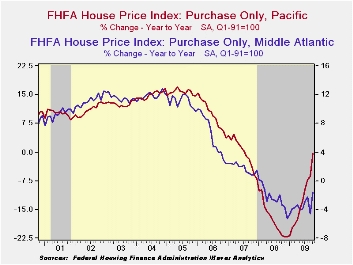
 Notable monthly gains in home prices during October were
logged in the Pacific, Middle Atlantic and the East South Central
regions of the country and the y/y declines have moderated
significantly. In the populous East North Central region prices slipped
another 0.6% during October and they were flat year-to-date. Prices
also fell sharply in the South Atlantic region to the lowest level
since 2004.
Notable monthly gains in home prices during October were
logged in the Pacific, Middle Atlantic and the East South Central
regions of the country and the y/y declines have moderated
significantly. In the populous East North Central region prices slipped
another 0.6% during October and they were flat year-to-date. Prices
also fell sharply in the South Atlantic region to the lowest level
since 2004.
| FHFA U.S. House Price Index Purchase Only (%) | October | September | Y/Y | 2008 | 2007 | 2006 |
|---|---|---|---|---|---|---|
| Total | 0.6 | -0.4 | -1.9 | -5.8 | 1.3 | 6.0 |
| New England | 0.0 | 0.3 | -1.8 | -4.6 | -1.7 | 1.1 |
| Middle Atlantic | 1.8 | -1.5 | -1.6 | -2.3 | 1.9 | 6.3 |
| East North Central | -0.6 | -0.7 | -1.9 | -4.4 | -1.3 | 1.8 |
| West North Central | 0.2 | 0.0 | -0.7 | -2.8 | 1.0 | 3.2 |
| South Atlantic | -1.1 | 0.2 | -4.1 | -7.2 | 1.3 | 7.1 |
| East South Central | 1.6 | -1.5 | -0.4 | -1.4 | 3.8 | 7.2 |
| West South Central | 0.5 | -0.3 | 0.0 | 0.6 | 4.7 | 7.2 |
| Mountain | 0.8 | -1.4 | -7.5 | -6.1 | 3.9 | 10.6 |
| Pacific | 3.7 | -0.9 | -0.3 | -17.3 | 0.1 | 9.8 |

Tom Moeller
AuthorMore in Author Profile »Prior to joining Haver Analytics in 2000, Mr. Moeller worked as the Economist at Chancellor Capital Management from 1985 to 1999. There, he developed comprehensive economic forecasts and interpreted economic data for equity and fixed income portfolio managers. Also at Chancellor, Mr. Moeller worked as an equity analyst and was responsible for researching and rating companies in the economically sensitive automobile and housing industries for investment in Chancellor’s equity portfolio. Prior to joining Chancellor, Mr. Moeller was an Economist at Citibank from 1979 to 1984. He also analyzed pricing behavior in the metals industry for the Council on Wage and Price Stability in Washington, D.C. In 1999, Mr. Moeller received the award for most accurate forecast from the Forecasters' Club of New York. From 1990 to 1992 he was President of the New York Association for Business Economists. Mr. Moeller earned an M.B.A. in Finance from Fordham University, where he graduated in 1987. He holds a Bachelor of Arts in Economics from George Washington University.
More Economy in Brief


