 Global| Nov 14 2003
Favorable Growth Reports for Entire Euro-zone, Japan and Taiwan
Summary
Early third-quarter GDP reports from more countries indicate that growth resumed or improved most everywhere. Eurostat tallied a 0.4% gain in its "flash" estimate, after two negative quarters. This put GDP up 0.3% over a year ago, [...]
Early third-quarter GDP reports from more countries indicate that growth resumed or improved most everywhere. Eurostat tallied a 0.4% gain in its "flash" estimate, after two negative quarters. This put GDP up 0.3% over a year ago, breaking a deteriorating trend that had reduced year-on-year growth to a minimal 0.2% in Q2. A detailed report on the sources of this improvement is due December 3. Separate data on trade in the various constituent countries suggest that export demand is providing a major boost.
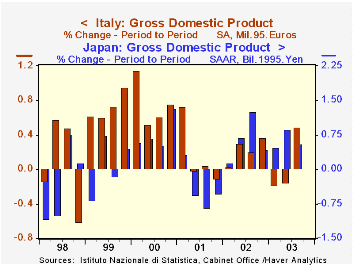
In Italy, growth resumed after two down quarters, with a respectable 0.5% gain from Q2. That too halted a weakening in the trend year-on-year pace.
Growth marked two Asian reports today as well. Japan's Q3 GDP was up 0.6%, its seventh consecutive increase. Available components do show an important role for exports in this growth and also for private investment. Unlike most other countries, Japan has seen investment in plant and equipment on a rising trend, indeed, for five straight quarters. Industrial production of capital goods is also expanding, corroborating the GDP data. In Taiwan, widespread gains in consumption, fixed investment, and exports all contributed to an upturn in the economy in Q3. These data are available in current prices only, but with only modest changes in prices in Taiwan, they are probably sufficient to describe "real" developments. The in-and-out trade that characterizes that economy is evident in a sizable increase in imports as well as exports, but the trade surplus still widened.
Press reports point to strong growth in the US and in China as boosting growth in other countries. US imports were actually flat in Q3, but they expanded markedly in five of the six prior periods. Chinese imports are growing very rapidly, expanding on a sustained basis this year at a 40% year-on-year pace. Europe is a particular beneficiary of this increasing demand, which is surely supporting its upturn.
| GDP Percent Changes | Qtr/QtrYear/ Year | 4th Qtr/4th Qtr||||||
|---|---|---|---|---|---|---|---|
| 3rd Qtr 2003 | 2nd Qtr 2003 | 1st Qtr 2003 | 2002 | 2001 | 2000 | ||
| Euro-zone | 0.4 | -0.1 | -0.0 | 0.3 | 1.1 | 0.8 | 2.8 |
| Italy | 0.5 | -0.1 | -0.2 | 0.5 | 0.9 | 0.6 | 3.1 |
| Japan | 0.6 | 0.9 | 0.5 | 2.3 | 2.5 | -1.6 | 3.1 |
| Taiwan (current prices) | 5.1 | -2.1 | -1.8 | 2.4 | 2.6 | -1.1 | 3.9 |
Carol Stone, CBE
AuthorMore in Author Profile »Carol Stone, CBE came to Haver Analytics in 2003 following more than 35 years as a financial market economist at major Wall Street financial institutions, most especially Merrill Lynch and Nomura Securities. She had broad experience in analysis and forecasting of flow-of-funds accounts, the federal budget and Federal Reserve operations. At Nomura Securities, among other duties, she developed various indicator forecasting tools and edited a daily global publication produced in London and New York for readers in Tokyo. At Haver Analytics, Carol was a member of the Research Department, aiding database managers with research and documentation efforts, as well as posting commentary on select economic reports. In addition, she conducted Ways-of-the-World, a blog on economic issues for an Episcopal-Church-affiliated website, The Geranium Farm. During her career, Carol served as an officer of the Money Marketeers and the Downtown Economists Club. She had a PhD from NYU's Stern School of Business. She lived in Brooklyn, New York, and had a weekend home on Long Island.
More Economy in Brief


