 Global| Mar 03 2009
Falling Rates & Prices Push Affordability to New High
by:Tom Moeller
|in:Economy in Brief
Summary
The National Association of Realtors indicated that pending sales of existing homes fell 7.7% in January to a record low. The decline left sales 7.4% below the 2008 average and it was roughly twice the Consensus expectation. The home [...]
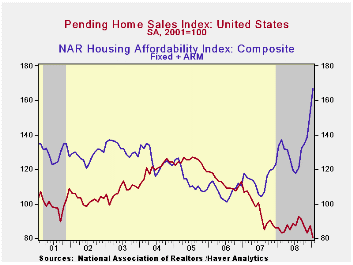
The National Association of Realtors indicated that pending sales of existing homes fell 7.7% in January to a record low. The decline left sales 7.4% below the 2008 average and it was roughly twice the Consensus expectation.
The home sales figures are analogous to the new home sales data from the Commerce Department in that they measure existing home sales when the sales contract is signed, not at the time the sale is closed. The series dates back to 2001.
Lower prices continued to bolster home sales. The median sales
price of an existing home fell in January for the seventh straight
month and was down 14.8% year-to-year. Prices were down 25.7% from
their peak during June 2007. For single-family homes alone, prices fell
2.9% during January and they were off 25.9% from their peak. Lower
prices combined with lower interest rates significantly raised the
affordability index of a home by 24.9% year-to-year. The latest level
was a record high for the series which extends back to 1970.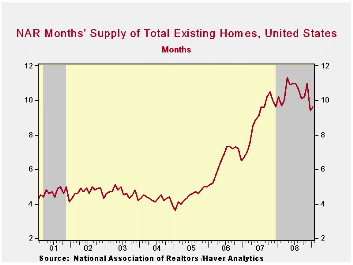
Weak home sales are encouraging potential sellers to keep their homes off the market. The Realtors Association indicated in an earlier report that the number of homes on the market and available for sale fell by 13.5% last month versus January of last year.
At the current sales rate there was a 9.6 months' supply of homes on the market and there was a 10.4 months' supply during all of last year, up from the 8.9 months supply during 2007 and 6.5 months during 2006. For single family homes, there was a 9.2 months' supply in January versus a full-year figure of 10.0 months.
The pending home sales data are available in Haver's PREALTOR database. The number of homes on the market and prices are in the REALTOR database.
Current economic and financial conditions and the federal budget is today's testimony by Fed Chairman Ben S. Bernanke and it is available here.
| Pending Home Sales (2001=100) | January | December | Y/Y | 2008 | 2007 | 2006 |
|---|---|---|---|---|---|---|
| Total | 80.4 | 87.1 | -6.4% | 86.8 | 95.8 | 112.1 |
| Northeast | 57.8 | 66.2 | -19.7 | 72.6 | 85.6 | 98.5 |
| Midwest | 72.6 | 80.0 | -13.8 | 80.6 | 89.5 | 102.0 |
| South | 82.2 | 93.3 | -9.1 | 89.8 | 107.3 | 127.3 |
| West | 103.6 | 101.1 | 13.5 | 99.3 | 92.1 | 109.5 |
by Tom Moeller March 3, 2009
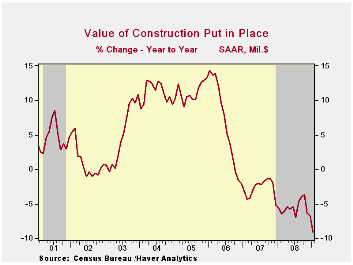
The news on building activity continues grim. The value of construction put-in-place tumbled 3.3% during January for the third consecutive, sharp decline. The drop was was roughly double the Consensus expectation.
Residential building activity continued its downward march with a 2.9% shortfall which started 2009 activity 18.6% below the 2008 average. Single-family construction activity fell 9.3% and remained off by nearly one half year-to-year. Building activity on multi-family units also was weak and it posted a 1.2% decline (-9.1% y/y). Spending on improvements did increase 3.8% from December but versus one year ago it fell 1.5%.
During the last twenty years there has been an 84% correlation between the q/q change in the value of residential building and its contribution to growth in real GDP.
The value of nonresidential building activity continued lower,
down for the sixth month in the last seven. January activity fell 4.3%
led by a 5.8% decline in the health care sector (+6.4% y/y). Spending
on office construction fell another 1.5% and it was off 10.4% from one
year earlier. Building in the multi-retail sector flopped 1.8% and that
decline pulled activity down 20.2% from last January.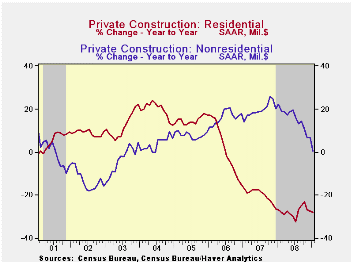
Public construction may have started to suffer the recession's effect of tax revenues. Activity fell 2.3% and that lowered year-to-year growth to 4.4%, the least since early 2005. To amplify the notion of weakness, the level of activity began this year 0.9% below 2008. The value of spending on transportation facilities fell 2.6% (-2.4% y/y), down hard for the third straight month. Spending on highways & streets also fell for the second month but the 1.0% decline still left activity up 6.1% y/y, in line with the firm gains since early 2007. The value of construction on highways & streets is roughly one-third of the value of total public construction spending.
The more detailed categories of construction represent the Census Bureau’s reclassification of construction activity into end-use groups. Finer detail is available for many of the categories; for instance, commercial construction is shown for automotive sales and parking facilities, drugstores, building supply stores, and both commercial warehouses and mini-storage facilities. Note that start dates vary for some seasonally adjusted line items in 2000 and 2002, and that constant-dollar data are no longer computed.
The construction put-in-place figures are available in Haver's USECON database.
| Construction (%) | January | December | Y/Y | 2008 | 2007 | 2006 |
|---|---|---|---|---|---|---|
| Total | -3.3 | -2.4 | -9.1 | -5.6 | -2.7 | 6.3 |
| Private | -3.7 | -2.6 | -14.1 | -9.8 | -6.9 | 5.5 |
| Residential | -2.9 | -4.4 | -28.0 | -27.6 | -19.8 | 1.0 |
| Nonresidential | -4.3 | -1.2 | 0.3 | 14.9 | 19.6 | 16.2 |
| Public | -2.3 | -1.8 | 4.4 | 6.8 | 12.3 | 9.3 |
by Tom Moeller March 3, 2009
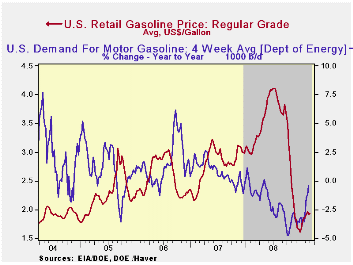
According to the U.S. Department of Energy, regular gasoline prices rose two cents last week and the increase left them in the middle of the $1.89 to $1.96 range in place since early February. At an average $1.93 per gallon prices remained near their recent high, up 32 cents from the December low. Yesterday, the spot market price for regular gasoline reversed course and fell to $1.22, down eight cents from Friday and down eight cents from the early February high of $1.32 per gallon.
Weekly gasoline prices can be found in Haver's WEEKLY
database. Daily prices are in the DAILY
database.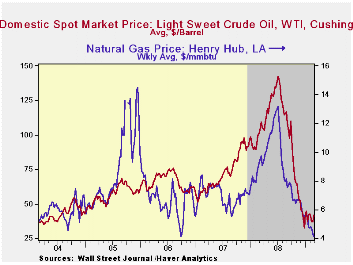
Downward momentum in gasoline demand continued to ease last week according to the U.S. Department of Energy. The year-to-year change of -0.5% compared to its worst comparison of -4.8% last October after gasoline prices were hitting their peak. The change in demand is the latest four weeks versus the same four weeks in 2008. Demand for all petroleum products was down 0.8% year-to-year after the -8.0% comparison last October. These numbers are available in Haver's OILWKLY database.
The price for a barrel of West Texas Intermediate crude rose last week to $41.81 per barrel. Like gasoline, crude oil prices have been trading this year in a tight range between $37.00 and $44.50 per barrel. Prices reached a high of $145.66 last July. In futures trading yesterday, the one-month price for crude oil was $40.15 per barrel. Last week's average was $42.18.
The price of natural gas fell further last week to $4.16 per mmbtu (-54.7% y/y), the lowest level since September 2006. The latest average price was down more than two-thirds from the high reached in early-July of $13.19/mmbtu.
| Weekly Prices | 03/02/09 | 02/23/09 | Y/Y | 2008 | 2007 | 2006 |
|---|---|---|---|---|---|---|
| Retail Regular Gasoline ($ per Gallon) | 1.93 | 1.91 | -38.8% | 3.25 | 2.80 | 2.57 |
| Light Sweet Crude Oil, WTI ($ per bbl.) | 41.81 | 36.99 | -58.6% | 100.16 | 72.25 | 66.12 |
by Tom Moeller March 3, 2009
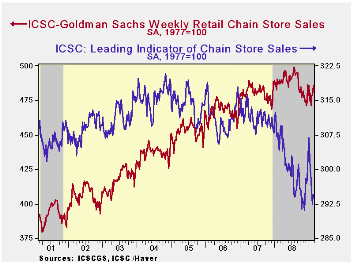
Chain store sales dipped 0.6% last week (Feb.28) and that did reverse the prior week's increase, according to the International Council of Shopping Centers-Goldman Sachs Index. But the combination of large gains at the end of January and further, modest February increases raised sales for all of last month by 1.0% above the January average.
The chain store sales figures are available in Haver's SURVEYW database.
During the last ten years there has been a 64% correlation between the year-to-year growth in chain store sales and the growth in general merchandise sales.
The ICSC-Goldman Sachs retail chain-store sales index is constructed using the same-store sales (stores open for one year) reported by 78 stores of seven retailers: Dayton Hudson, Federated, Kmart, May, J.C. Penney, Sears and Wal-Mart.
The outlook for sales, however, remains cautious. The weekly leading indicator of chain store sales from ICSC-Goldman Sachs slipped 0.2% last week and so far for February was down 2.3% from January (-3.4% y/y).
The Recent Increase in the Volatility of Economic Indicators from the Federal Reserve Bank of Cleveland can be found here.
| ICSC-UBS (SA, 1977=100) | 02/28/09 | 02/21/09 | Y/Y | 2008 | 2007 | 2006 |
|---|---|---|---|---|---|---|
| Total Weekly Chain Store Sales | 483.0 | 485.9 | -0.8% | 1.4% | 2.8% | 3.3% |
by Robert Brusca March 3, 2009
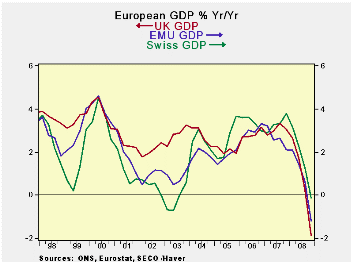
Swiss GDP is taking a hit like the rest of European GDP.
Capital formation in Switzerland is being hit especially hard.
Switzerland, the graph above shows, has been somewhat resistant to
decline in its GDP aggregate until recently when the drop has been very
severe. With banking as a key Swiss industry and the economy hit so
hard, it is no wonder than Switzerland has been drawn into the vortex
of European decline. Switzerland is also a trade-dependent country with
exports plus imports topping aggregate GDP in value. Exports are more
than 50% of GDP by themselves. With the European economy in a shambles,
Swiss exports are being clobbered. Of course Switzerland imports a lot
too, and imports have fallen in percentage terms even more than exports
for the year, but not for the quarter. The trade situation is a big
detractor to Swiss GDP over the quarter as well as over the year due to
the relative size of exports in the Swiss economy.
So far Switzerland has weathered the storm of European
weakness by pumping up government spending. Public sector spending was
up at a 2.9% pace in Q4 and is up by 3.4% Yr/Yr. That helped to drive
up domestic demand in the quarter but Yr/Yr domestic demand is still
dropping. Europe’s weakness has Switzerland fully in its grasp and the
troubles in Swiss banking will pose an added problem for the Swiss
authorities, trying to the keep the economy afloat.
Longer term, Switzerland’s banking sector may prove to be even
more of a problem. With a global banking crisis in full bloom the rest
of the world is pushing hard for transparency. Switzerland has long
held a unique position in the global markets with bank secrecy. But
banking problems have become so severe that in the European summit of
one week ago the Europeans called for strong actions against tax
havens. UBS, a major Swiss bank, currently is embroiled in a major
fight in the US where it helped US citizens perpetrate tax fraud. The
Americans are pushing for the release of the names of about 50,000
American citizens that have accounts at UBS. UBS has offered up a much
smaller number of about 250 names. US authorities are pressing UBS and
do not seem likely to accept interventions by the Swiss authorities as
cover. Although the situation gets complicated because a suit filed in
Switzerland is trying to enjoin UBS from releasing these names as it is
a crime – a violation of Swiss bank secrecy laws - to do so. The issue
and question of bank secrecy and whether it will remain a right is now
under a full court press. With so many scandals and allegations of
fraud in play the international banking authorities do not want to
encounter and black box of secrecy at the end of their chase- as is
happening to the US right now. To Switzerland this is a very important
issue- but it is also important to other banking sectors where
authorities have become increasing suspicious of secrecy anywhere.
| Swiss GDP | |||||||
|---|---|---|---|---|---|---|---|
| Consumption | Capital | Trade Domestic | |||||
| GDP | Private | Public | Formation | Exports | Imports | Demand | |
| % change Q/Q | |||||||
| Q4-08 | -1.2% | 0.4% | 2.9% | -12.0% | -28.5% | -21.3% | 7.6% |
| Q3-08 | -0.3% | 0.5% | 5.7% | -7.2% | 1.1% | -2.9% | -2.5% |
| Q2-08 | 0.5% | 2.5% | 3.2% | -2.9% | 14.0% | 14.0% | -1.1% |
| Q1-08 | 0.5% | 0.6% | 1.7% | 1.1% | -2.7% | -12.0% | -4.2% |
| % change Yr/Yr | |||||||
| Q4-08 | -0.1% | 1.0% | 3.4% | -5.4% | -5.4% | -6.4% | -0.1% |
| Q3-08 | 1.3% | 1.5% | 1.2% | -1.3% | 4.9% | 2.0% | -0.6% |
| Q2-08 | 2.3% | 2.2% | -1.8% | -2.0% | 6.5% | 3.4% | 0.3% |
| Q1-08 | 3.1% | 2.2% | -2.6% | 1.9% | 3.7% | 0.3% | 1.4% |
| 5-Yrs | 2.5% | 1.7% | 0.1% | 2.0% | 5.5% | 3.5% | 1.3% |
by Louise Curley March 4, 2009
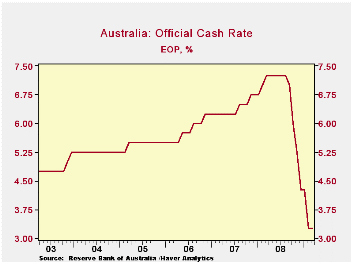 The
Australian Central Bank kept its benchmark interest rate at 3.25% today
after reductions of 400 basis points over the last seven months, as
shown in the first chart. Governor Glenn Stevens,
in announcing the decision, remarked that "In Australia, demand has not
weakened as much as in other countries and, on the basis of currently
available information, the Australian economy has not experienced the
sort of large contraction seen elsewhere.
The
Australian Central Bank kept its benchmark interest rate at 3.25% today
after reductions of 400 basis points over the last seven months, as
shown in the first chart. Governor Glenn Stevens,
in announcing the decision, remarked that "In Australia, demand has not
weakened as much as in other countries and, on the basis of currently
available information, the Australian economy has not experienced the
sort of large contraction seen elsewhere.
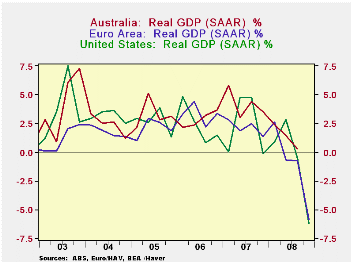 Through
the third quarter of this year Australia has managed to register
positive advances in GDP while the U. S. and the Euro Area began to
show declines in the second and third quarters, as can be seen in the
second chart. Australia's fourth quarter will be announced
tomorrow and is expected to show a much smaller, if any, decline than
that shown by the U. S. and the Euro Area. The Reserve Bank of
Australia which forecasts year to year changes in GDP and inflation has
yet for forecast a decline in GDP. Their last three forecasts
for GDP are shown in the third chart. Their latest forecast
shows the lowest growth at 0.25% in the second quarter of 2009.
Through
the third quarter of this year Australia has managed to register
positive advances in GDP while the U. S. and the Euro Area began to
show declines in the second and third quarters, as can be seen in the
second chart. Australia's fourth quarter will be announced
tomorrow and is expected to show a much smaller, if any, decline than
that shown by the U. S. and the Euro Area. The Reserve Bank of
Australia which forecasts year to year changes in GDP and inflation has
yet for forecast a decline in GDP. Their last three forecasts
for GDP are shown in the third chart. Their latest forecast
shows the lowest growth at 0.25% in the second quarter of 2009.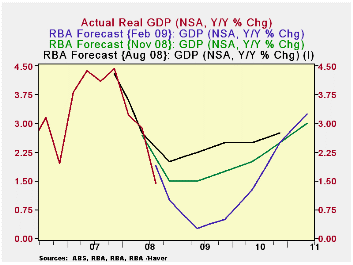
Australia has, as noted above, moved aggressively to lower
interest
rates and market and mortgage rates have responded and are at
historical lows. Business loan rates have also declined. Moreover, the
government has injected A$8.9 billion in to the economy with cash
handouts to the elderly and low income families that no doubt accounted
for much of the unusually big increase of 3.8% in retail sales in
December. Last month, Prime Minister, Kevin Rudd, indicated
that he will spend another A$42 billion on cash handouts and
infrastructure.
| Q4 08 | Q3 08 | Q2 08 | Q1 08 | Q4 07 | |
|---|---|---|---|---|---|
| SAAR REAL GDP % | |||||
| Australia | 0.25 | 1.43 | 2.41 | 3.49 | |
| Euro Area | -5.84 | -0.74 | -0.72 | 2.67 | 1.34 |
| United States | -6.25 | -0.51 | 2.83 | 0.87 | -0.17 |
| Australia | Jan 09 | Dec 08 | Nov 08 | Oct 08 | Sep 07 |
| Retail trade (SA M/M %) | 0.24 | 3.82 | 0.43 | 0.96 | -1.60 |
by Tom Moeller March 3, 2009
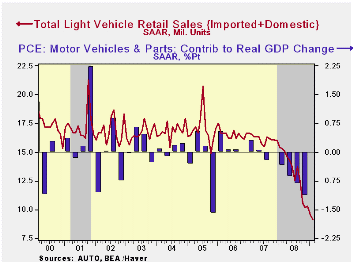
What can be said about the decline in U.S. vehicle sales that hasn't already been noted? It's been picking up momentum recently. It's been to the lowest level since 1982. It's been broad-based across manufacturers and product type. U.S. unit sales of light vehicles fell a surprising 4.7% m/m to 9.12M (SAAR) from 9.57M during January. Sales of 9.6M had been expected for February. The latest figure was the lowest since June of 1982 according to the Autodata Corporation and Ward's Automotive News. (Seasonal adjustment of the figures is provided by the U.S. Bureau of Economic Analysis). The increased downward momentum portion of the story is that the February decline pulled the comparison versus a year ago to -40 6% which was its worst since the data became available in the late 1960s.
Sales of domestically-made light vehicles
again were particularly hard hit. They posted a 6.8% month-to-month
decline from January to 6.29 million units. That decline came on the
heels of January's 12.2% drop. The level is now 45.5% below February
2008. Sales of domestically made light trucks led last month's
downdraft with a 13.0% decline to 3.4M units. That was countered to an
extent by a 1.7% m/m rise in domestic auto sales, but February's
increase followed a 20.8% January decline and they still were off by
almost one-half from February 2008.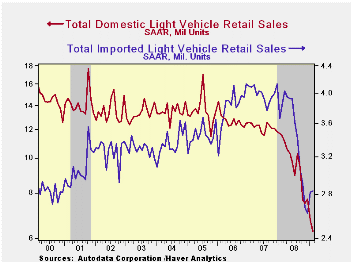
Imported light vehicle sales again outperformed the domestics last month as they posted a modest increase after January's 7.6% increase. Nevertheless, sales fell 25.9% year-to-year but the decline still is far less than for U.S. made vehicles. Sales of imported light trucks were the strongest as they increased 3.1% from January. The increase enabled sales of imported light trucks to grab 24.4% of the market; a record and more than double the share of ten years earlier. Sales of imported autos slipped 1.1% (-28.1% y/y) from January after that month's 8.5% rise.
Import's share of the U.S. light vehicle market jumped to a record 31.1% in February, up almost five percentage points from the 2008 average. (Imported vehicles are those produced outside the U.S. and do not include vehicles with the nameplate of a foreign manufacturer produced within the U.S.)
The U.S. vehicle sales figures can be found in Haver's USECON database.
| Light Vehicle Sales (SAAR, Mil. Units) | February | January | December | Feb.'09 / Feb.'08 | 2008 | 2007 | 2006 |
|---|---|---|---|---|---|---|---|
| Total | 9.12 | 9.57 | 10.31 | -40.6% | 13.17 | 16.16 | 16.54 |
| Autos | 4.63 | 4.60 | 5.21 | -37.2 | 6.71 | 7.58 | 7.77 |
| Domestic | 2.89 | 2.84 | 3.59 | -41.7 | 4.42 | 5.07 | 5.31 |
| Imported | 1.74 | 1.76 | 1.62 | -28.1 | 2.29 | 2.52 | 2.45 |
| Light Trucks | 4.50 | 4.97 | 5.10 | -43.7 | 6.47 | 8.60 | 8.78 |
| Domestic | 3.40 | 3.91 | 4.10 | -48.3 | 5.29 | 7.10 | 7.42 |
| Imported | 1.10 | 1.06 | 1.00 | -22.2 | 1.18 | 1.47 | 1.37 |

Tom Moeller
AuthorMore in Author Profile »Prior to joining Haver Analytics in 2000, Mr. Moeller worked as the Economist at Chancellor Capital Management from 1985 to 1999. There, he developed comprehensive economic forecasts and interpreted economic data for equity and fixed income portfolio managers. Also at Chancellor, Mr. Moeller worked as an equity analyst and was responsible for researching and rating companies in the economically sensitive automobile and housing industries for investment in Chancellor’s equity portfolio. Prior to joining Chancellor, Mr. Moeller was an Economist at Citibank from 1979 to 1984. He also analyzed pricing behavior in the metals industry for the Council on Wage and Price Stability in Washington, D.C. In 1999, Mr. Moeller received the award for most accurate forecast from the Forecasters' Club of New York. From 1990 to 1992 he was President of the New York Association for Business Economists. Mr. Moeller earned an M.B.A. in Finance from Fordham University, where he graduated in 1987. He holds a Bachelor of Arts in Economics from George Washington University.
More Economy in Brief


