 Global| Dec 15 2009
Factory Production Resumes Increase
by:Tom Moeller
|in:Economy in Brief
Summary
Industrial production resumed the increase that began this past July. The November 0.8% gain followed an unrevised unchanged reading for October and it exceeded Consensus expectations for a 0.6% rise. The improvement from October was [...]
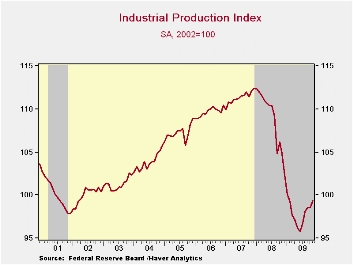 Industrial
production resumed the increase that began this past July. The November
0.8% gain followed an unrevised unchanged reading for October and it
exceeded Consensus expectations for a 0.6% rise. The improvement from
October was across-the-board but it was greatest in the construction
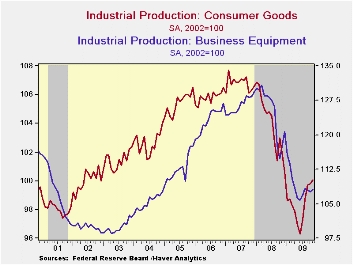
supplies and in the materials areas. Output of consumer goods rose a
moderate 0.3% and that was led by a 2.9% (-13.5% y/y) increase in
furniture production and a 1.9% (-6.9% y/y) increase in motor vehicle
output. Output of machinery also rose (-19.7% y/y) as did computers
& electronics (-4.0% y/y) production. Less the motor vehicle
& high-tech sectors output increased 0.8% (-5.1% y/y)
last month.
Industrial
production resumed the increase that began this past July. The November
0.8% gain followed an unrevised unchanged reading for October and it
exceeded Consensus expectations for a 0.6% rise. The improvement from
October was across-the-board but it was greatest in the construction
supplies and in the materials areas. Output of consumer goods rose a
moderate 0.3% and that was led by a 2.9% (-13.5% y/y) increase in
furniture production and a 1.9% (-6.9% y/y) increase in motor vehicle
output. Output of machinery also rose (-19.7% y/y) as did computers
& electronics (-4.0% y/y) production. Less the motor vehicle
& high-tech sectors output increased 0.8% (-5.1% y/y)
last month.
 During
November, production increases amongst
industries sagged somewhat to 52.9% of the total from the high of 60.6%
during August. The breadth of increase from last July also dipped to a
still-firm 59.9%, near the strongest since early-2007.
During
November, production increases amongst
industries sagged somewhat to 52.9% of the total from the high of 60.6%
during August. The breadth of increase from last July also dipped to a
still-firm 59.9%, near the strongest since early-2007.
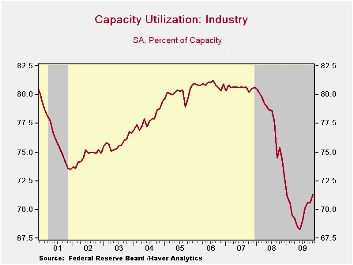 Capacity
utilization rose further to 71.3%, its
highest level since December. In the factory sector alone utilization
rose to 68.4%. Utilization in the primary metals area has risen sharply
to 59.1% with the rebound in output. There's also been a slight rise in
utilization in the machinery area but it's down most elsewhere. The
overall increase was caused by another estimated 0.1% (-0.9% y/y)
decline in industry capacity.
Capacity
utilization rose further to 71.3%, its
highest level since December. In the factory sector alone utilization
rose to 68.4%. Utilization in the primary metals area has risen sharply
to 59.1% with the rebound in output. There's also been a slight rise in
utilization in the machinery area but it's down most elsewhere. The
overall increase was caused by another estimated 0.1% (-0.9% y/y)
decline in industry capacity.
The industrial production data are available in Haver's USECON database.
| Industrial Production (SA,%) | November | October | September | Y/Y | 2008 | 2007 | 2006 |
|---|---|---|---|---|---|---|---|
| Total Output | 0.8 | 0.0 | 0.5 | -5.2 | -2.2 | 1.5 | 2.3 |
| Manufacturing | 1.1 | -0.2 | 0.6 | -4.8 | -3.2 | 1.4 | 2.5 |
| Consumer Goods | 0.3 | 0.1 | 1.0 | -1.9 | -2.6 | 0.9 | 0.4 |
| Business Equipment | 0.5 | -0.3 | -0.4 | -8.1 | -1.1 | 2.7 | 9.4 |
| Construction Supplies | 1.6 | -1.6 | -1.2 | -12.5 | -6.3 | -2.0 | 2.3 |
| Materials | 1.2 | 0.1 | 0.7 | -4.8 | -1.9 | 2.0 | 2.3 |
| Utilities | -1.8 | 1.6 | 0.3 | -5.1 | 0.3 | 3.4 | -0.6 |
| Capacity Utilization (%) | 71.3 | 70.6 | 70.0 | 74.4 (Nov. '08) | 77.5 | 80.6 | 80.9 |

Tom Moeller
AuthorMore in Author Profile »Prior to joining Haver Analytics in 2000, Mr. Moeller worked as the Economist at Chancellor Capital Management from 1985 to 1999. There, he developed comprehensive economic forecasts and interpreted economic data for equity and fixed income portfolio managers. Also at Chancellor, Mr. Moeller worked as an equity analyst and was responsible for researching and rating companies in the economically sensitive automobile and housing industries for investment in Chancellor’s equity portfolio. Prior to joining Chancellor, Mr. Moeller was an Economist at Citibank from 1979 to 1984. He also analyzed pricing behavior in the metals industry for the Council on Wage and Price Stability in Washington, D.C. In 1999, Mr. Moeller received the award for most accurate forecast from the Forecasters' Club of New York. From 1990 to 1992 he was President of the New York Association for Business Economists. Mr. Moeller earned an M.B.A. in Finance from Fordham University, where he graduated in 1987. He holds a Bachelor of Arts in Economics from George Washington University.
More Economy in Brief


