 Global| Jan 24 2008
Existing Home Sales Lowest Since 1998, Prices Off 10% Since Peak
by:Tom Moeller
|in:Economy in Brief
Summary
According to the National Association of Realtors, sales of existing single family homes slipped 2.0% during December after a very slight 0.7% uptick in November. The decline was to the lowest level since 1998 and since the sales peak [...]
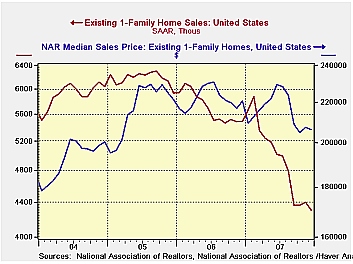
According to the National Association of Realtors, sales of
existing single family homes slipped 2.0% during December after a very
slight 0.7% uptick in November. The decline was to the lowest level
since 1998 and since the sales peak in late 2005, sales were down by
roughly one third. For the full year sales fell 13.0% on top of a 7.7%
decline in 2005.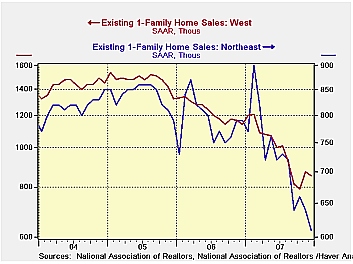
Sales including condominiums fell 2.2% last month and ended the year down 22.0% from last December, down 12.8% for the full year.
By region, home sales in the Northeast fell 4.6% (-22.4% y/y)
and for the full year were off 7.5% after the 6.9% 2006 drop. In the
Midwest December sales fell 1.7%, 10.6% for the full year, while sales
in the South ended the year with a 1.0% drop. Combined with a 2.0% fall
in November overall sales in the South last year fell 13.0%. The worst
of it came out West. The 2.1% December decline pulled sales for the
year down 19.2% after a 16.2% drop during 2006. For the full year,
sales of single family homes in the West was the lowest since 1998.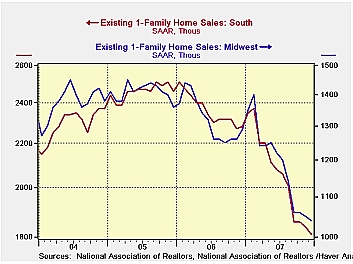
The median price of an existing single family home fell 0.4% (-6.5% y/y) in December. It was the fifth m/m decline in the last six months. It lowered prices for the full year 2.8% below the 2006 level, the first full year decline in the thirty five year history of the series. Since the peak early last year, home prices were off 9.9% in December.
Perspectives on Housing and the Economic Outlook from the Federal Reserve Bank of Kansas City can be found here.
The latest Budget Outlook from the Congressional Budget Office is available here.
| Existing
Single Family Home Sales |
December | y/y % | November | December '06 | 2007 | 2006 | 2005 |
|---|---|---|---|---|---|---|---|
| Total | 4,890 | -22.0 | 5,000 | 6,270 | 5,679 | 6,510 | 7,075 |
| Northeast | 830 | -22.4 | 870 | 1,070 | 1,007 | 1,088 | 1,169 |
| Midwest | 1,160 | -20.5 | 1,180 | 1,160 | 1,334 | 1,492 | 1,588 |
| South | 1,970 | -20.9 | 1,990 | 2,490 | 2,243 | 2,578 | 2,704 |
| West | 940 | -24.8 | 960 | 1,250 | 1,094 | 1,353 | 1,616 |
| Single-Family | 4,310 | -21.6 | 4,400 | 5,500 | 4,966 | 5,708 | 6,182 |
| Median Price, Total, $ | 206,500 | -6.5 | 207,300 | 220,800 | 215,642 | 221,883 | 217,492 |
by Tom Moeller January 24, 2008
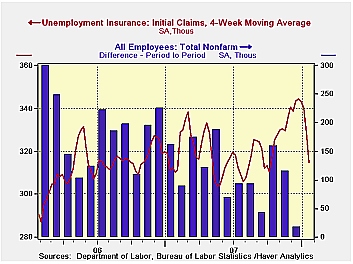
Initial claims for jobless insurance remained unexpectedly low last week. A 1,000 w/w decline followed sharp declines during the prior three weeks which now have totaled 15.7% since the high one month ago. The latest level was the lowest since September.
Initially, this drop in claims was doubted as genuine due to the difficulties of seasonal adjustment during the Holiday season. Those difficulties suggested that claims would bounce up last week. Indeed, a rise to 320,000 had been the Consensus expectation. No special factors were sighted by the Labor Department as having influenced last week's figure.
The four week moving average of initial claims, a measure
which smoothes out most of the series' w/w volatility, fell sharply to
314,750 (+0.7% y/y). It was the lowest level since mid-October and may
suggest that recent labor market weakening was not as great as earlier
perceived. But in a wishy-washy spirit, the perception
should not be wholly dismissed based on the new figures. 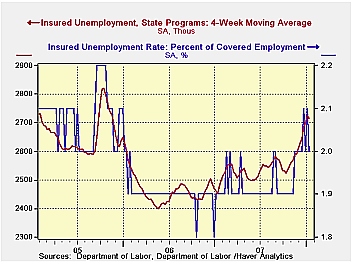
A claims level below 400,000 typically has been associated with growth in nonfarm payrolls. During the last six years there has been a (negative) 78% correlation between the level of initial claims and the m/m change in nonfarm payroll employment.
Continuing claims for unemployment insurance dropped 75,000. It reversed a 59,000 increase during the prior week which was revised down slightly. The figure provides some indication of workers' ability to find employment but here again difficulties of seasonal adjustment this time of year are great.
The continuing claims numbers lag the initial claims figures by one week.
The insured rate of unemployment fell back to 2.0% from 2.1% during the prior week.
Monetary Policy Implementation Frameworks: A Comparative Analysis from the Federal Reserve Bank of New York is available here.
| Unemployment Insurance (000s) | 01/19/08 | 01/12/07 | Y/Y | 2006 | 2005 | 2004 |
|---|---|---|---|---|---|---|
| Initial Claims | 301 | 322 | 4.9% | 313 | 331 | 343 |
| Continuing Claims | -- | 2,751 | 11.3% | 2,459 | 2,662 | 2,924 |
by Robert Brusca January 24, 2008
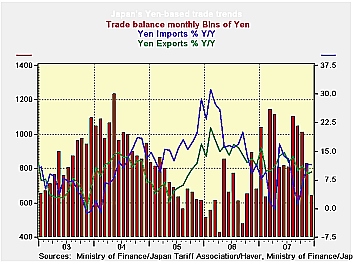
Japan’s exports show a withering trend as Japan’s imports continue to rise at a brisk pace. Export and import price indexes, however, show that export volumes are being maintained better than the nominal figures tell us as export prices are falling and falling faster than nominal exports are shrinking. Imports on the other hand are not as strong as nominal figures show since prices are rising sharply. While imports are up by 37% in the past three months from August to November, import prices rose by less at 35.8% for October through December. As a result Japan’s nominal trade figures give exactly the opposite impression of what is going on.
Nominal imports are rising, while real imports are actually
slowing. On the export side nominal exports are falling, but export
volumes are in fact still expanding. Rising oil prices are creating a
misdirection in terms of import trends. For exports, the rise in the
yen accounts for the drop in export prices. The yen’s rise tends to
result in a reduction of yen export prices, as though exports are
denominated in foreign currency. Volume still seems to be rising, but
if this is a currency effect it could be a warning that profits for
exports are in for a set back.
| Japan Trade Trends | |||||||
|---|---|---|---|---|---|---|---|
| in period level of % chg | Average in period/or % change | ||||||
| All data yen basis | Dec-07 | Nov-07 | Oct-07 | 3Mo Prev | 6Mo Prev | 12Mos Prev | 12 mo Ago |
| Balance on Goods | -- | 11,959 | 13,141 | 11,929 | 11,196 | 10,628 | 7,838 |
| % m/m | % saar | ||||||
| Exports Goods % | 0.9% | 0.6% | 1.9% | 1.5% | 6.9% | 9.6% | 22.1% |
| Motor Vehicles | 2.5% | -3.9% | 17.9% | -6.1% | 11.3% | 16.2% | 40.7% |
| Imports Goods % | 3.9% | 3.6% | 2.9% | 35.8% | 13.7% | 11.4% | 24.1% |
| Motor Vehicles | -25.2% | -7.5% | 9.8% | -84.4% | -53.1% | -27.4% | -23.3% |
| Prices in %, SAAR | 3-Mos | 6-Mos | 12-Mos | 12 mos Ago | |||
| Export Prices | 0.1% | -1.3% | 0.7% | -5.3% | -10.4% | -1.8% | 1.4% |
| Import Prices | 4.9% | 0.7% | 3.8% | 37.2% | 10.0% | 12.6% | 6.6% |
| Memo: Yen/$, AVG, Level | 112.45 | 111.07 | 115.87 | 113.13 | 115.43 | 117.76 | 116.35 |
| Memo Yen Percent ('-' is a fall) | -1.2% | 4.1% | -0.7% | 13.9% | 16.0% | 4.2% | 1.0% |
by Robert Brusca January 24, 2008
Bounce raises the question of EMU-US de-coupling.
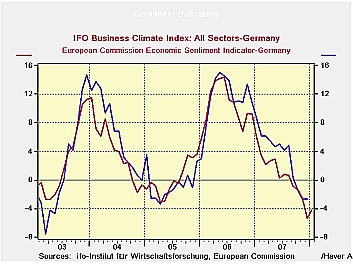
Apparently Germans agree… They agree with the ECB that
weakness does not threaten Germany or Europe and they see better times
ahead as the IFO expectations index that looks six months into the
future rose enough to kick the climate index higher. No wonder Axel
Weber, Bundesbank president, was saying that markets do not understand
the ECB and are too driven by short-term horizons. Weber, in comments
today, hinted that the next ECB move could be to tighten, not to ease
as markets had expected just yesterday.
These events raise the question of whether markets have
de-coupled or whether either Europe’s or the US central bankers are
just plain wrong about the outlook. Can Europe be so strong that it may
need to tighten if the US is as weak as all the fiscal and monetary
stimulus in train seem to expect? Or is Germany and the ECB simply
wrong in their outlook? Or is the Fed and Congress wrong and just too
wrapped up in the needs of US short-term presidential election year
politics?
We can’t tell here and now, but time will tell.
The respondents to the IFO survey did see somewhat weaker
current conditions, but not much weaker. At a value of 107.9 the
current index is still in the top quartile of its range. It slipped by
just 0.2 points in January, less than in December. It is still well
above its average value of 95.0. It is lower year/year by 4.2%, less
than the 6.2% drop registered on that basis in December.
Business expectations improved by 0.8% in Germany. This
propelled the overall climate index up to 103.4 from 103.0 in December.
Expectations are still lower by 4.1% Yr/Yr less than the 4.3% drop
registered in December. But the IFO survey is hardly a report ringing
warning bells in the ears of the ECB.
The overall EU index for Germany had already slowed its rate
of descent in December. Now the IFO actually has improved. We seem to
have a decoupling in progress if the actions of the ECB and the Fed are
each correct. The question is: are they?
| IFO Survey: Germany | ||||||||
|---|---|---|---|---|---|---|---|---|
| Jan-08 | Dec-07 | Nov-07 | Oct-07 | Sep-07 | Aug-07 | Jul-07 | Jun-07 | |
| Biz Climate | -4.2% | -5.3% | -2.5% | -1.4% | -1.0% | 0.7% | 0.8% | 0.3% |
| Current Situation | -4.3% | -6.2% | -3.2% | -2.1% | -1.3% | 2.5% | 2.4% | 1.6% |
| Biz Expectations | -4.1% | -4.3% | -2.0% | -0.8% | -0.4% | -1.1% | -0.9% | -1.3% |
by Robert Brusca January 24, 2008
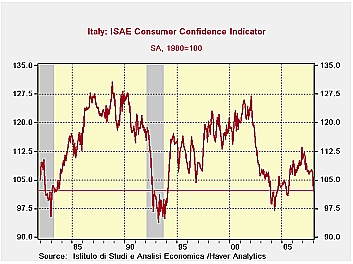
Italy shivers while the Euro Area overheats: What good can
come of this?
Not only is PM Prodi having a difficult time, but so is the
Italian consumer. Whatever fate awaits Prodi, the consumer is already
giving a vote of no-confidence to it. This is despite some resilient
data from elsewhere in the Euro Area. The German IFO index actually
rose in January. The ECB is thinking of hiking rates according to some
of the day’s commentary. If you are an Italian consumer however, you
must wonder if the world has gone mad. The Euro Area may be coming into
one of its really big tests. Inflation has run hotter in some EMU
countries than in others. But because of the single currency there has
been no relief for competitiveness. There is no local currency to
depreciate. Italy is one of those regions.
Since all EMU countries are pent up in the same currency area,
what will affect competitiveness within the Zone, as well as between
the Zone and other areas that is nationally different, is the local
inflation rate, as well as any productivity differences. The small
table below shows that since March of 2000 Finland is the most
competitive EMU nation with a national price index that is some 7.2%
below the EMU average for that period. Germany is next at -4.2%. Italy
ranks as seventh worst among the 12 countries ranked here with a price
level that is 1.2 percentage points ABOVE the EMU average. That would
make Italy some 5.4% less competitive than Germany for the period and
8.4% behind Finland. Ranking below Italy is The Netherlands,
Luxembourg, Portugal, Ireland, Spain and Greece.
| Is the Italian Consumer an Example of…Trouble in the Zone? | |||
|---|---|---|---|
| HICP | March 2000 | High to Low | Gap |
| Sep-07 | Rank | W/EMU | |
| Austria | 16.5% | 10 | -2.6% |
| Belgium | 18.1% | 8 | -1.0% |
| Finland | 11.9% | 12 | -7.2% |
| France | 17.1% | 9 | -2.0% |
| Germany | 14.9% | 11 | -4.2% |
| Greece | 30.2% | 1 | 11.1% |
| Ireland | 28.6% | 3 | 9.5% |
| Italy | 20.3% | 7 | 1.2% |
| Luxembourg | 25.3% | 5 | 6.2% |
| The Netherlands | 21.1% | 6 | 2.0% |
| Portugal | 27.0% | 4 | 8.0% |
| Spain | 29.0% | 2 | 9.9% |
| EMU Total | 19.1% | -- | -- |
If Italy’s problems are due to that sort of competitiveness
loss we should also find encroaching weakness in those lower ranked
countries as well.
For now, whatever the source, Italy’s consumers are feeling
the pinch. Confidence is in the bottom 20% of its range. The current
overall situation is in the bottom six percent of its range. The
expected overall situation in the next 12 months is the worst in this
period. And so on, see the percentile column in the table above. The
Italian household sees things as being bad, and as getting much worse.
It is no wonder Prodi is having trouble, and it will be a real test of
European unity to see what happens in Italy if the ECB goes ahead with
the rate hikes that the Bundesbank’s Weber was warning of today.
| Italy ISAE Consumer Confidence | ||||||||||
|---|---|---|---|---|---|---|---|---|---|---|
| Since January 1999 | ||||||||||
| Dec 07 |
Nov 07 |
Oct 07 |
Sep 07 |
%tile | Rank | Max | Min | Range | Mean | |
| Consumer Confidence | 107 | 107.6 | 107.3 | 107.3 | 33.3 | 63 | 127 | 97 | 30 | 111 |
| Last 12 months | ||||||||||
| OVERALL SITUATION | -69 | -71 | -67 | -63 | 23.0 | 69 | -22 | -83 | 61 | -55 |
| PRICE TRENDS | -21.5 | -24.5 | -23.5 | -26.5 | 29.6 | 61 | 4 | -32 | 36 | -16 |
| Next 12months | ||||||||||
| OVERALL SITUATION | -35 | -35 | -33 | -30 | 0.0 | 99 | 24 | -35 | 59 | -13 |
| PRICE TRENDS | 28 | 25.5 | 26 | 31 | 50.0 | 40 | 49 | 7 | 42 | 23 |
| UNEMPLOYMENT | 4 | 3 | 2 | -2 | 87.2 | 8 | 9 | -30 | 39 | -6 |
| HOUSEHOLD BUDGET | 9 | 6 | 6 | 5 | 29.4 | 60 | 33 | -1 | 34 | 14 |
| HOUSEHOLD FIN SITUATION | ||||||||||
| Last 12 months | -44 | -43 | -44 | -39 | 7.5 | 95 | -7 | -47 | 40 | -29 |
| Next12 months | -14 | -12 | -14 | -13 | 0.0 | 99 | 14 | -14 | 28 | -2 |
| HOUSEHOLD SAVINGS | ||||||||||
| Current | 60 | 63 | 58 | 54 | 93.0 | 2 | 63 | 20 | 43 | 39 |
| Future | -37 | -39 | -42 | -33 | 15.2 | 97 | -9 | -42 | 33 | -24 |
| MAJOR Purchases | ||||||||||
| Current | -47 | -48 | -45 | -42 | 23.8 | 60 | -15 | -57 | 42 | -41 |
| Future | -61 | -63 | -66 | -65 | 38.7 | 41 | -42 | -73 | 31 | -62 |
| Total number of months: | 100 | |||||||||

Tom Moeller
AuthorMore in Author Profile »Prior to joining Haver Analytics in 2000, Mr. Moeller worked as the Economist at Chancellor Capital Management from 1985 to 1999. There, he developed comprehensive economic forecasts and interpreted economic data for equity and fixed income portfolio managers. Also at Chancellor, Mr. Moeller worked as an equity analyst and was responsible for researching and rating companies in the economically sensitive automobile and housing industries for investment in Chancellor’s equity portfolio. Prior to joining Chancellor, Mr. Moeller was an Economist at Citibank from 1979 to 1984. He also analyzed pricing behavior in the metals industry for the Council on Wage and Price Stability in Washington, D.C. In 1999, Mr. Moeller received the award for most accurate forecast from the Forecasters' Club of New York. From 1990 to 1992 he was President of the New York Association for Business Economists. Mr. Moeller earned an M.B.A. in Finance from Fordham University, where he graduated in 1987. He holds a Bachelor of Arts in Economics from George Washington University.
More Economy in Brief


