 Global| Sep 02 2008
Euro Area Overall PPI Jumps: Sector Trends Diverge
Summary
The July PPI in the e-zone jumped by 1.1% in July continuing to spread inflation pressure in the e-zone. Ex energy the PPI rose by 0.5% after a 0.4% spurt in June. As a result even ex-energy inflation is looking troublesome. Ex energy [...]
The July PPI in the e-zone jumped by 1.1% in July continuing to spread inflation pressure in the e-zone. Ex energy the PPI rose by 0.5% after a 0.4% spurt in June. As a result even ex-energy inflation is looking troublesome. Ex energy e-Zone inflation is running at 4.3% Yr/Yr, at a 5.1% pace over six months and at a barely reduced 4.7% pace over three months. While this is the PPI not the ECB’s favored HICP measure, the strength in prices will not go down well at the ECB. Germany, Italy and the UK generally show accelerating patterns of headline PPI inflation as well as ex-energy inflation. Among those three only Italy does not show inflation accelerating over the recent three months compared to six months and 12-months for ex-energy inflation.
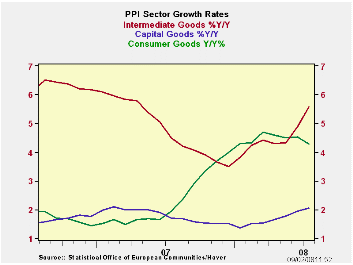
The e-zone headline inflation rate for the PPI is now up by 9% Yr/Yr compared with ex-energy inflation at 4.7%. Capital goods inflation remains subdued at 2% Yr/Yr. But consumer goods inflation is up by 4.3%. Energy prices are up 24% Yr/Yr. Inflation trends in the e-zone are like nothing the ECB would ever want to tolerate, but here they are.
| E-zone and UK PPI Trends | ||||||
|---|---|---|---|---|---|---|
| M/M | Saar | |||||
| Euro Area 15 | Jul-08 | Jun-08 | 3-Mo | 6-MO | Yr/Yr | Y/Y Yr Ago |
| TotalxConstruct | 1.1% | 1.0% | 14.2% | 11.8% | 9.0% | 1.8% |
| Excl Energy | 0.5% | 0.4% | 4.7% | 5.1% | 4.3% | 2.9% |
| Capital Gds | 0.2% | 0.2% | 2.3% | 2.5% | 2.0% | 1.7% |
| Consumer Gds | 0.2% | 0.2% | 2.3% | 2.9% | 4.3% | 1.9% |
| Intermediate&Cap Gds | 0.6% | 0.5% | 5.9% | 6.3% | 4.2% | 3.4% |
| Energy | 2.8% | 2.8% | 46.3% | 33.5% | 24.5% | -1.8% |
| MFG | 0.6% | 0.7% | 10.9% | 9.6% | 7.2% | 2.3% |
| Germany | 2.0% | 0.9% | 16.7% | 13.4% | 8.9% | 1.1% |
| ExEnergy | 0.7% | 0.3% | 5.4% | 5.1% | 3.6% | 2.4% |
| Italy | 0.5% | 0.8% | 11.4% | 10.4% | 8.3% | 2.0% |
| ExEnergy | 0.1% | 0.5% | 3.4% | 5.1% | 4.1% | 3.1% |
| UK | 0.2% | 2.9% | 25.3% | 20.9% | 20.0% | 0.2% |
| ExEnergy | 0.5% | 0.8% | 11.6% | 10.3% | 7.6% | 3.0% |
| Euro Area 15 Harmonized PPI excluding Construction. | ||||||
| The EA 15 countries are Austria, Belgium, Cyprus, Finland, France, Germany, Greece, Ireland, Italy, Luxembourg, Malta, Netherlands, Portugal, Slovenia and Spain. | ||||||

Robert Brusca
AuthorMore in Author Profile »Robert A. Brusca is Chief Economist of Fact and Opinion Economics, a consulting firm he founded in Manhattan. He has been an economist on Wall Street for over 25 years. He has visited central banking and large institutional clients in over 30 countries in his career as an economist. Mr. Brusca was a Divisional Research Chief at the Federal Reserve Bank of NY (Chief of the International Financial markets Division), a Fed Watcher at Irving Trust and Chief Economist at Nikko Securities International. He is widely quoted and appears in various media. Mr. Brusca holds an MA and Ph.D. in economics from Michigan State University and a BA in Economics from the University of Michigan. His research pursues his strong interests in non aligned policy economics as well as international economics. FAO Economics’ research targets investors to assist them in making better investment decisions in stocks, bonds and in a variety of international assets. The company does not manage money and has no conflicts in giving economic advice.
More Economy in Brief


