 Global| Jan 16 2009
EMU Trade Deficit Widens: Exports and Imports Collapse
Summary
The EMU trade deficit widened in November as exports fell by 4.7%. Imports also dropped but by 2.5% causing the deficit to widen. The table above is replete with negative numbers denoting declining export and import flows. The global [...]
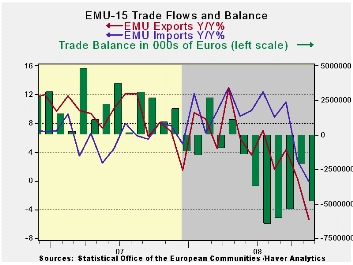
The EMU trade deficit widened in November as exports fell by
4.7%. Imports also dropped but by 2.5% causing the deficit to widen.
The table above is replete with negative numbers denoting declining
export and import flows. The global downturn is hitting trade hard on
both the export and the import side. Among exports raw materials and
manufactured goods are both being hit hard. On the import side weakness
is in oil imports but spreads across all groupings.
Over 12-months exports are lower by 5.1% and imports are off
by 0.1%. In contrast a year before exports had risen over 12-months by
6.8% and imports were up by 7.7%. Even in Yr/Yr terms the slowdown is
rapid and that is why the economic dislocations are so severe.
The figures for EMU are of course figures for EMU member trade
outside of the block. The various national figures also include
intra-EMU state trading. EMU countries are very prone to trade. Since
these flows are slowing down it is hitting a lot of EMU economies very
hard. Germany, the largest exporter in the world, is being clobbered by
export weakness. German exports are down by 9% Yr/Yr in November,
nearly twice the EMU pace. The trade picture is a bleak one for EMU
members.
| Ezone 15-Trade trends for goods | ||||||
|---|---|---|---|---|---|---|
| m/m% | % Saar | |||||
| Nov-08 | Oct-08 | 3M | 6M | 12M | 12M Ago | |
| Balance* | €€ (4,891) | €€ (2,122) | €€ (4,154) | €€ (4,800) | €€ 2,124 | €€ (1,483) |
| Exports | ||||||
| All Exp | -4.7% | -2.8% | -22.6% | -10.8% | -5.3% | 6.8% |
| Food and Drinks | -3.0% | 0.9% | -5.2% | -3.3% | 1.6% | 12.9% |
| Raw materials | -13.0% | -3.2% | -58.8% | -34.9% | -12.2% | -0.2% |
| Other | -4.6% | -3.0% | -22.6% | -10.6% | -5.7% | 6.6% |
| MFG | -4.0% | -1.6% | -22.8% | -10.8% | -6.6% | 4.2% |
| IMPORTS | ||||||
| All IMP | -2.5% | -5.1% | -24.5% | -5.6% | -0.1% | 7.7% |
| Food and Drinks | -2.9% | -1.3% | -12.4% | -7.8% | -3.7% | 18.0% |
| Raw materials | -0.4% | -4.5% | -6.7% | 4.8% | 8.3% | 1.4% |
| Other | -2.6% | -5.3% | -26.0% | -6.1% | -0.3% | 7.4% |
| MFG | -0.5% | -2.3% | -12.9% | -1.8% | -1.3% | 3.6% |
| *Eur mlns; mo or period average | ||||||

Robert Brusca
AuthorMore in Author Profile »Robert A. Brusca is Chief Economist of Fact and Opinion Economics, a consulting firm he founded in Manhattan. He has been an economist on Wall Street for over 25 years. He has visited central banking and large institutional clients in over 30 countries in his career as an economist. Mr. Brusca was a Divisional Research Chief at the Federal Reserve Bank of NY (Chief of the International Financial markets Division), a Fed Watcher at Irving Trust and Chief Economist at Nikko Securities International. He is widely quoted and appears in various media. Mr. Brusca holds an MA and Ph.D. in economics from Michigan State University and a BA in Economics from the University of Michigan. His research pursues his strong interests in non aligned policy economics as well as international economics. FAO Economics’ research targets investors to assist them in making better investment decisions in stocks, bonds and in a variety of international assets. The company does not manage money and has no conflicts in giving economic advice.
More Economy in Brief


