 Global| Jun 27 2018
EMU Nominal Money and Credit Flows Pickup
Summary
EMU money and credit growth both picked up in May but mainly in nominal terms. The graph shows the nominal year-on-year growth rates and in that depiction the advance in money and credit growth in May hardly stands out. When deflated [...]
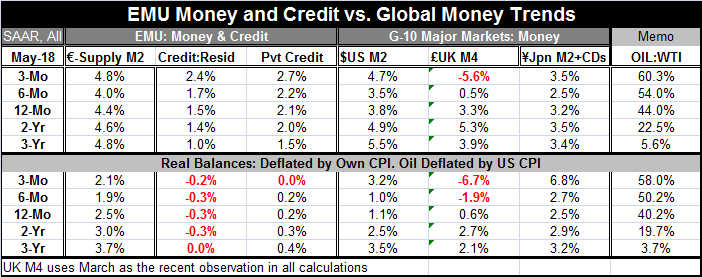
 EMU money and credit growth both picked up in May but mainly in nominal terms. The graph shows the nominal year-on-year growth rates and in that depiction the advance in money and credit growth in May hardly stands out. When deflated by the HICP to purge money and credit of the influence of inflation, we find the following:
* Real money supply growth does tick higher over three months compared to six months moving its growth rate up to 2.1% from 1.9%, but it is still well below its 12-month, two-year and three-year rates of growth. The money growth ‘uptick’ is only that, an uptick, not a move of any consequence.
* Credit to residents continues to decline after inflation adjustment. Its declining pace of 0.2% over three months is smaller than its pace of decline of 0.3% over six months. And it is the ‘best’ since credit growth was flat over a three-year horizon. But credit is still declining and the pick up again is not more than a meager uptick.
* Private credit, the credit metric we care about most, is weaker at 0% over three months and weaker than all the previous growth rates in the table.
On balance, money and credit growth adjusted for inflation are doing very little and there is almost no sign of any financial demand stirring. The ECB talking about exiting policies of ease and making its plans to do so, but credit flows clearly are not the motivating factor in this decision.
Turning attention to the data in the table, we are reminded of the role of rising energy prices in this period. West Texas oil prices are up at a 60% annual pace over three months, at a 54% annual pace over six months and by 44% over 12 months. It is a period when oil prices have been broadly rising; thus, adding some juice to short-term measured inflation rates.
 The United States and Japan experience somewhat higher rates of nominal money growth over three months compared to six months and in both cases the three-month pace also exceeds the 12-month pace. But since inflation is now higher than it was in earlier periods and since in each case money growth fell over six months compared to 12 months before rising at all, this three-month rise in money growth is not a very important signal and simply reflects the impact of fast-rising oil prices in the short run. In the U.K. on data that lag by one month, money growth actually fell over three months.
Turning to real data (inflation-adjusted), we find again ongoing strong gains in ‘real’ oil prices. And here both the U.S. and Japan show relatively strong three-month increases in real money supply growth. Japan’s money supply growth is by far the strongest in any recent timeline at a real growth at a whopping 6.8% annualized rate. But even with the three-month spike included Japan’s six-month pace settles down to a 2.7% mark, only two ticks better than its 12-month pace and below previous growth rates. The U.K. on lagged data logs contraction in both its three-month and six-month pace of money growth.
It is worth noting the background here is for roughly stable money growth expressed in both real and nominal terms. The U.K. is the exception with falling real and nominal money growth rates. I make this mention because we are on the cusp of having various tariffs go into effect and there is going to be a lot of questioning and investigation of how the economy performed and why it performs that way in the wake of these tariffs being imposed. The U.S. is seeking better, fairer trade terms and has launched the tariff round with impositions on steel and aluminum justified by a national security rationale that most of its G7 trade partners have rejected. Yet, most do run trade surpluses vs. the U.S. on their respective bilateral accounts and most impose tariffs higher than any residual tariffs than the U.S. charges on their goods. Most of the G-7 countries, party to this dispute, also run current account and trade surpluses vs. the U.S. (Canada runs a current account surplus and trade account deficit; the U.K. trade position is in flux around balance).
There is a lot of change and conflict afoot in the global economy. Clearly, Donald Trump is adding to it by being true to his campaign pledge that the U.S. would not bear everyone else’s burden. And he ran on a platform of fairer trade. Europe preferred Obama who may have made some of the same points as Trump, but never pressed them on it. Trump is pressing them on it and going well beyond what any U.S. president has asked for in the past. The Europeans may not like it but viewed from a distance it is hard to see the U.S. claims as without merit… although Trump’s way of approaching matters is not the most copacetic of approaches.

Robert Brusca
AuthorMore in Author Profile »Robert A. Brusca is Chief Economist of Fact and Opinion Economics, a consulting firm he founded in Manhattan. He has been an economist on Wall Street for over 25 years. He has visited central banking and large institutional clients in over 30 countries in his career as an economist. Mr. Brusca was a Divisional Research Chief at the Federal Reserve Bank of NY (Chief of the International Financial markets Division), a Fed Watcher at Irving Trust and Chief Economist at Nikko Securities International. He is widely quoted and appears in various media. Mr. Brusca holds an MA and Ph.D. in economics from Michigan State University and a BA in Economics from the University of Michigan. His research pursues his strong interests in non aligned policy economics as well as international economics. FAO Economics’ research targets investors to assist them in making better investment decisions in stocks, bonds and in a variety of international assets. The company does not manage money and has no conflicts in giving economic advice.
More Economy in Brief


