 Global| Jul 11 2019
EMU Inflation: Is It Easing or Is It in a Jagged Uptrend?
Summary
The chart makes the point best on the problem of how to interpret the trends for inflation in the largest EMU nations. Going back to 2014 or 2016, we find inflation has been rising across all the countries in the chart. From about [...]
 The chart makes the point best on the problem of how to interpret the trends for inflation in the largest EMU nations. Going back to 2014 or 2016, we find inflation has been rising across all the countries in the chart. From about 2017, the estimated trends for the moves in the HICPs would be more or less flat with a very poor fit. If we measure from mid-2018 to date, inflation is moving lower.
Note that that is reflected in headline rates as well as the cores (or ex-energy measures) in the table. Core and headline rates show less lift over 12 months than over the previous 12 months albeit their changes are small and all the core rates of inflation are below 2% over 12 months as well over the previous 12 months.
Inflation is accelerating!
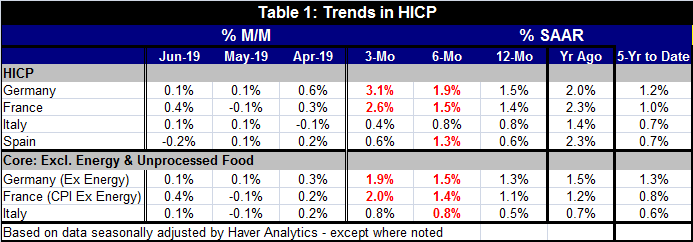
The top table shows some year-on-year trends and also focuses on the within one-year trends from 12-months to six-months to three-months. These sequential rates show acceleration on all measures across all countries except for headline inflation in Italy and Spain and an elusive trend for Italian core inflation.
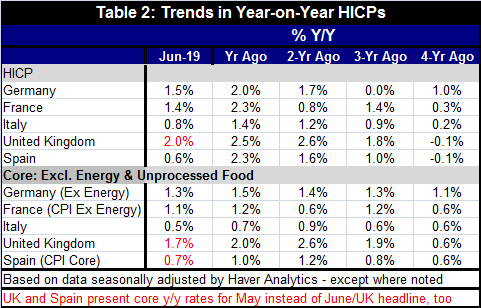
Year-on-year trends measured back from four years ago show acceleration in train until the current year as a general condition. France shows some wavering in this trend for both the headline and core with some variation in acceleration coming earlier in the time series. For Italy asserting there is a trend there somewhere for core inflation is taking hair-splitting to a new extreme. In Italy where the economy continues to struggle, we see core inflation less than 1% on all horizons! In the U.K., core inflation has decelerated for two years in a row; the same is true of Spain. On this timeline, Spain has only one year of core inflation above the 1% mark.
Taking a broader view (Table 1), we see that the five-year pace for headline inflation has been 1.2% at the highest among this group (Germany). Italy has the lowest pace at 0.7% (tied with Spain). For core or ex-energy inflation, again, Germany has the highest 5-year (5-YTD) pace at 1.3% with Italy the lowest at 0.6%.
Inflation accelerates then decelerates
I think there are several takeaways from these trends and results.
• First, inflation is and has been low- well below targeted levels for both core and headline measures.
• Second, while there are differences among members, the predominate feature is that inflation trends seem to roll though all of these nations with roughly the same timing and much the same impact. That is important from the standpoint of ECB policymaking.
• Third, from separate analysis, we find the inflation differences among the original EMU members are now down near all-time lows.
• Fourth, the core inflation rates give us some (vague) sense that Keynesianism still matters. Germany is the hottest economy in this group and has the highest inflation; Italy is the weakest, still not back to its prerecession level of real GDP, and it has the weakest inflation.
Inflation is a complicated concept. It is more complicated in the EMU where country level statistics are kept in separate boxes and provide us with many different measures for even adjacent contiguous economic areas using the same currency. In the U.S., there are separate state-wide inflation metrics, but they are rarely ever part of the U.S. inflation analysis. Understanding inflation is complicated beyond what weights to use in Europe or whether one should look at the headline or the core. The main complication –as always- is about how to treat new pressures when they arise. The point of using a core rate or a trimmed mean or median rate or an ex-energy rate is to try to get at that part of an inflation measure that is robust and will be ongoing. This is a terrifically difficult thing to do. We provide inflation calculated year-on-year over six months and over three months as an aid to try to see where inflation is going. But these horizons, while good at showing the direction and intensity of current pressures, often are not that helpful to ferreting out the lasting trend. That difficulty remains one of the key problems in understanding inflation. Despite that issue, it is clear that inflation in Europe for now is low and for some considerable time has been too low.

Robert Brusca
AuthorMore in Author Profile »Robert A. Brusca is Chief Economist of Fact and Opinion Economics, a consulting firm he founded in Manhattan. He has been an economist on Wall Street for over 25 years. He has visited central banking and large institutional clients in over 30 countries in his career as an economist. Mr. Brusca was a Divisional Research Chief at the Federal Reserve Bank of NY (Chief of the International Financial markets Division), a Fed Watcher at Irving Trust and Chief Economist at Nikko Securities International. He is widely quoted and appears in various media. Mr. Brusca holds an MA and Ph.D. in economics from Michigan State University and a BA in Economics from the University of Michigan. His research pursues his strong interests in non aligned policy economics as well as international economics. FAO Economics’ research targets investors to assist them in making better investment decisions in stocks, bonds and in a variety of international assets. The company does not manage money and has no conflicts in giving economic advice.
More Economy in Brief


