 Global| Oct 16 2006
Empire State Index Highest Since June
by:Tom Moeller
|in:Economy in Brief
Summary
Unexpectedly, the October index of manufacturing activity in New York State improved to its highest level since this past June. The Empire State Manufacturing Index of General Business Conditions rose 9.1 points to 22.92 versus [...]
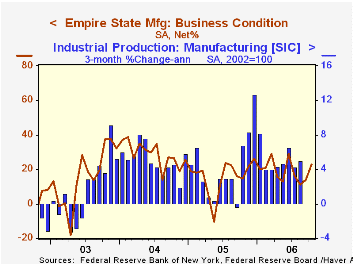
Unexpectedly, the October index of manufacturing activity in New York State improved to its highest level since this past June. The Empire State Manufacturing Index of General Business Conditions rose 9.1 points to 22.92 versus Consensus expectations for a slight decline to 11.3. The figures are reported by the Federal Reserve Bank of New York.
Since the series' inception in 2001 there has been a 75% correlation between the index level and the three month change in U.S. factory sector industrial production.
The indexes for employment, inventories and shipments led the improvement though new orders, unfilled orders and delivery times fell. The rise in the employment index was to the second highest level this year.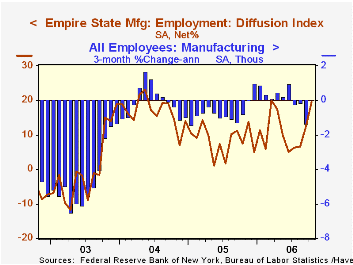
Like the Philadelphia Fed Index of General Business Conditions, the Empire State Business Conditions Index reflects answers to an independent survey question; it is not a weighted combination of the components.
Pricing pressure continued to ease. The prices paid index fell ten points to its lowest level in over a year. Since 2001 there has been an 88% correlation between the index of prices paid and the three month change in the core intermediate materials PPI.
Expectations, however, deteriorated. The Empire State index of expected business conditions in six months fell another five points to its lowest level since May reflecting declines in most sub-indexes, except employment. 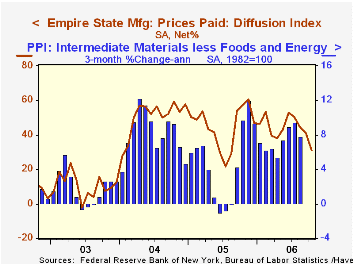
The Empire State Manufacturing Survey is a monthly survey of manufacturers in New York State conducted by the Federal Reserve Bank of New York. Participants from across the state in a variety of industries respond to a questionnaire and report the change in a variety of indicators from the previous month. Respondents also state the likely direction of these same indicators six months ahead. April 2002 is the first report, although survey data date back to July 2001.
For more on the Empire State Manufacturing Survey, including methodologies and the latest report, click here.
The U.S. Treasury Yield Curve: 1961 to the Present from the Federal Reserve Board is available here.
| Empire State Manufacturing Survey | October | September | Oct. '05 | 2005 | 2004 | 2003 |
|---|---|---|---|---|---|---|
| General Business Conditions (diffusion index) | 22.92 | 13.84 | 15.02 | 15.56 | 28.79 | 15.98 |
by Tom Moeller October 16, 2006
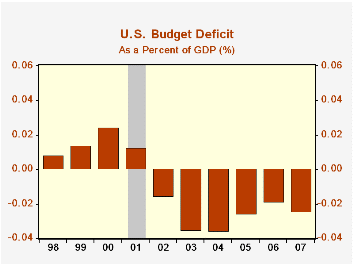
The U.S. federal government's budget deficit for FY 2006 fell to $247.7B following deficits near $300B during 2005 and $400B during 2004. The full year figure compared favorably to the August estimate from the Congressional Budget Office of a $260B deficit. CBO expects the FY 2007 deficit to total $286B.
As a percentage of GDP, the U.S. budget deficit fell to 1.9% from 2.6% in FY2005 but may return to 2.5% during the current year.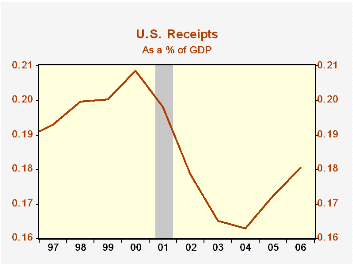
Net revenues grew 11.8% during FY2006. Individual income tax receipts (44% of total receipts) registered 12.6% growth after a 14.6% surge the prior year. Withheld taxes rose 7.9% due to growth in employment, nearly double the 4.4% gain during the prior fiscal year, and that was up from 2.5% growth during FY2004. Non-withheld taxes (primarily on capital gains) surged 20.7%, slightly slower than the 31.9% gain during FY2005. Corporate income taxes (13% of total receipts) surged 27.2% as corporate profits grew. Estate & gift taxes increased by 12.6% while higher employment levels raised social insurance & retirement receipts by 5.5%.
As a percentage of GDP revenues rose to 18.1%, the highest level in five years.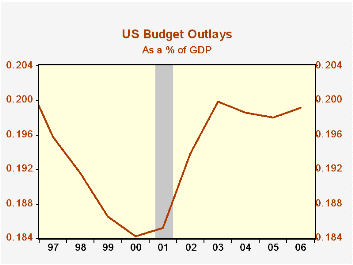
U.S. net outlays grew 7.4% last year versus 7.8% growth during FY2005. Defense spending (19% of total outlays) grew 6.8%, down from 8.6% growth during FY2005. Medicare expenditures (12% of outlays) advanced 10.5%, about stable with the prior year's growth, and social security spending (21% of outlays) rose a diminished 4.8%. Higher interest rates boosted the government's interest expense by 23.2% y/y.
As a percentage of GDP outlays rose to 19.9%, up more than one percentage point since 2000.
The Budget Results for Fiscal Year 2006 from the U.S. Treasury Department can be found here.
CBO's baseline projections of the U.S. budget are available here.
| US Government Finance | September | August | Y/Y | FY 2006 | FY 2005 | FY 2004 |
|---|---|---|---|---|---|---|
| Budget Balance | $56.0B | -$64.9B | $35.2B (9/05) |
-$247.7 | -$318.7B | -$412.7B |
| Net Revenues | $283.3B | $153.9B | 12.6% | 11.8% | 14.5% | 5.5% |
| Net Outlays | $227.3B | $218.8B | 5.0% | 7.4% | 7.8% | 6.2% |
by Louise Curley October 16, 2006
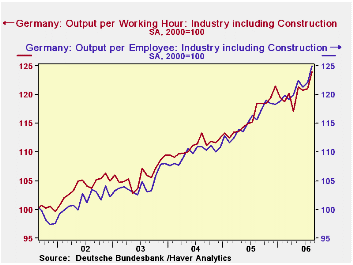
Growth in productivity together growth in the labor force largely determines a country's potential growth rate. Recent trends in German productivity, especially in industry, suggest that the recent increase in Germany's growth rate has solid underpinnings. Productivity in German Industry, as measured by output per employee, increased by 2.4% in August from July and was 8.0% above August, 2005. The comparable figures for productivity as measured by output per working hour are 2.5% and 11.6% respectively. The two measures differ from month to month but show the same general trends, as can be seen in the first chart. 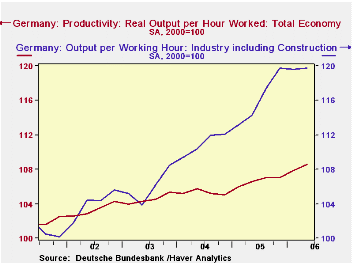
Germany also reports productivity data in more detail on a quarterly basis. Data are currently available only through the second quarter. Productivity for the total economy in the quarterly series is much lower than that of the productivity in industry in the monthly series, as can be seen in the second chart. Part of the difference in the two series is due to the fact that agriculture and public and personal service, both with low productivity are included in the quarterly series but not in the monthly series.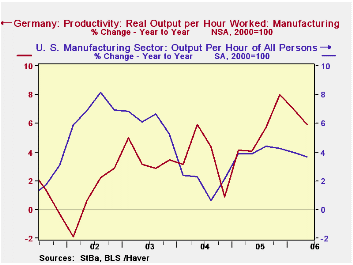
The growth in productivity in the manufacturing industry in Germany is now above that of the United States, as can be seen in the third chart. Moreover, when both indexes are compared on a common base year--2000--the current level of the German index is higher than that of the U. S.--meaning that the level of manufacturing productivity in Germany has now risen more than that of the U. S. since 2000.
| PRODUCTIVITY (2000=100) | Q2 06 | Q1 06 | Q2 05 | Q/Q % | Y/Y % | 2005 % | 2004 % | 2003 % |
|---|---|---|---|---|---|---|---|---|
| Manufacturing | ||||||||
| Germany | 131.25 | 117.29 | 123.94 | 11.94 | 5.93 | 5.47 | 3.59 | 3.58 |
| United States | 126.35 | 125.53 | 121.86 | 0.65 | 3.69 | 4.10 | 18.5 | 6.21 |
| Total Economy | ||||||||
| Quarterly Series | 108.55 | 107.80 | 106.52 | 0.66 | 1.91 | 1.32 | 0.69 | 1.21 |
| Monthly Series (Aggregated on a qtrly basis) |
119.7 | 119.6 | 114.3 | 0.11 | 4.78 | 4.68 | 4.72 | 1.83 |
| Monthly Series Total Economy | Aug 06 | Jul 06 | Aug 05 | M/M % | Y/Y % | 2005 % | 2004 % | 2003 % |
| Output per employee | 125.0 | 122.1 | 115.7 | 2.38 | 8.04 | 5.05 | 5.13 | 2.78 |
| Output per working hour | 124.0 | 121.0 | 118.5 | 2.48 | 4.64 | 4.68 | 4.72 | 1.83 |
Tom Moeller
AuthorMore in Author Profile »Prior to joining Haver Analytics in 2000, Mr. Moeller worked as the Economist at Chancellor Capital Management from 1985 to 1999. There, he developed comprehensive economic forecasts and interpreted economic data for equity and fixed income portfolio managers. Also at Chancellor, Mr. Moeller worked as an equity analyst and was responsible for researching and rating companies in the economically sensitive automobile and housing industries for investment in Chancellor’s equity portfolio. Prior to joining Chancellor, Mr. Moeller was an Economist at Citibank from 1979 to 1984. He also analyzed pricing behavior in the metals industry for the Council on Wage and Price Stability in Washington, D.C. In 1999, Mr. Moeller received the award for most accurate forecast from the Forecasters' Club of New York. From 1990 to 1992 he was President of the New York Association for Business Economists. Mr. Moeller earned an M.B.A. in Finance from Fordham University, where he graduated in 1987. He holds a Bachelor of Arts in Economics from George Washington University.
More Economy in Brief
 Global| Feb 05 2026
Charts of the Week: Balanced Policy, Resilient Data and AI Narratives
by:Andrew Cates


