 Global| Jan 15 2003
Empire State Factory Survey Up Again in January
by:Tom Moeller
|in:Economy in Brief
Summary
The Empire State Manufacturing Survey reported that the index of general business conditions rose more than expected this month. An unchanged reading versus December had been expected by some forecasters. Diffusion indexes for [...]

The Empire State Manufacturing Survey reported that the index of general business conditions rose more than expected this month. An unchanged reading versus December had been expected by some forecasters.
Diffusion indexes for shipments and employment rose. The orders index fell slightly but remained at a high level. The index of prices paid fell for the third consecutive month.
The figures reflect revisions to seasonal factors.
The survey includes measures of business expectations, six months ahead. The diffusion index for general business conditions fell again to the lowest level since February. Expectations for capital spending fell, but expectations for shipments and employment improved.
The Empire State Manufacturing Survey is a monthly survey of manufacturers in New York State conducted by the Federal Reserve Bank of New York. Participants from across the state in a variety of industries respond to a questionnaire and report the change in a variety of indicators from the previous month. Respondents also state the likely direction of these same indicators six months ahead. April 2002 is the first report, although survey data date back to July 2001.
Like the Philadelphia Fed Index of General Business Conditions, the Empire State Business Conditions Index reflects answers to an independent survey question, not the components.
For the latest Empire State Manufacturing Survey report, click here.
| Empire State Manufacturing Survey | Jan | Dec | Y/Y | 2002 | 2001 |
|---|---|---|---|---|---|
| General business conditions (diffusion index) | 20.72 | 12.32 | 14.26 | 7.07 | -13.81 |
by Tom Moeller January 15, 2003

Finished producer prices were weaker than expected last month, unchanged from November. Consensus expectations were for a 0.3% gain.
Excluding food and energy prices also were weaker than expectations. The 0.3% decline was the second in a row and the fourth decline in the last six months.
Just a modest 0.9% gain in finished energy prices was somewhat surprising (11.% y/y). Gasoline prices fell 6.7% (38.7% y/y) for the second consecutive monthly decline. Fuel oil prices rose a slight 1.7% following November's 10.7% slump (43.1% y/y). Residential gas prices also rose 1.5% following two strong gains in the months prior (9.0% y/y). These energy product price series are NSA.
Core finished consumer goods prices fell 0.3% for the second month (-0.1% y/y). Consumer durables prices dropped a sharp 0.8% (-1.7% y/y). Passenger car prices fell 2.6% (-4.7% y/y) and household appliance prices fell for the fourth consecutive month (-1.5% y/y). Many other consumer durables prices were either flat or down. Core nondurable goods prices were unchanged (1.2% y/y). Capital goods prices fell 0.4% (-0.9% y/y). Computer and communications equipment prices fell and prices for other machinery were tame or lower.
Intermediate goods prices fell for the second consecutive month as energy prices fell for a second consecutive month. Core intermediate prices fell 0.1%, the first decline since January.
Crude goods prices were again strong reflecting higher energy prices. Other commodities prices reflected in the core crude price measure rose reflecting another rise in scrap copper and aluminum prices. Steel scrap prices fell sharply for the fourth consecutive month.
| Producer Price Index | Dec | Nov | Y/Y | 2002 | 2001 | 2000 |
|---|---|---|---|---|---|---|
| Finished Goods | 0.0% | -0.4% | 1.2% | -1.3% | 2.0% | 3.7% |
| Core | -0.3% | -0.3% | -0.4% | 0.1% | 1.4% | 1.3% |
| Intermediate Goods | -0.1% | -0.1% | 2.9% | -1.5% | 0.4% | 4.9% |
| Core | -0.1% | 0.1% | 1.5% | -0.4% | -0.1% | 2.6% |
| Crude Goods | 1.9% | 5.1% | 26.0% | -10.6% | 0.3% | 22.8% |
| Core | 0.2% | 0.4% | 12.4% | 3.8% | -9.9% | 7.3% |
by Tom Moeller January 15, 2003
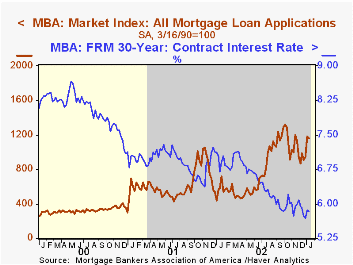
The index of mortgage applications, compiled by the Mortgage Bankers Association, fell a slight 2.4% following the 24.3% in the opening week of 2003.
Mortgage applications to refinance also were down just a bit after the 29.1% gain the week prior.
Mortgage applications for home purchase also fell, but gains the week prior had not been as strong as for refinancing.
Interest rates on conventional 30 Year mortgages were about stable at 5.84%, up versus the lows of late December.
For analysis by the Federal Reserve of mortgage refinancing trends, click here.
| MBA Mortgage Applications (3/16/90=100) | 1/10/03 | 1/03/03 | 2002 | 2001 | 2000 |
|---|---|---|---|---|---|
| Total Market Index | 1,154.3 | 1,182.3 | 799.7 | 625.6 | 322.7 |
| Purchase | 358.0 | 376.2 | 354.7 | 304.9 | 302.7 |
| Refinancing | 5,786.4 | 5,871.1 | 3,388.0 | 2,491.0 | 438.8 |
by Tom Moeller January 15, 2003

Total business inventories rose as expected in November. It was the seventh consecutive monthly gain in inventories. October's rise was revised down slightly due mostly to lowered figures for wholesale inventories.
Retail inventories (7.7% YTD, AR) rose strongly for the third consecutive month. Motor vehicle inventories jumped 1.7%, the third consecutive strong gain.
Nonauto retail inventories (2.3% YTD, AR) rose, continuing a rising trend started in April. Inventories of furniture & home furnishings built on an upwardly revised October estimate (10.0% YTD, AR). Inventories of apparel mostly reversed an October decline (2.6% YTD, AR). At general merchandise stores inventories surged 1.4% (1.1% YTD, AR).
Overall business sales rose a modest 0.3% (4.3% YTD, AR).
The inventory-to-sales ratio was stable at a low 1.36.
For analysis by the Federal Reserve Bank of New York of how inventory dynamics recently have changed, click here.
| Business Inventories | Nov | Oct | Y/Y | 2001 | 2000 | 1999 |
|---|---|---|---|---|---|---|
| Total | 0.2% | 0.1% | 0.6% | -6.3% | 5.6% | 5.4% |
| Retail | 0.8% | 0.7% | 7.1% | -5.0% | 6.1% | 7.7% |
| Retail excl. Autos | 0.5% | -0.3% | 1.9% | -2.0% | 4.1% | 5.7% |
| Wholesale | 0.3% | -0.5% | -1.7% | -5.5% | 6.6% | 6.0% |
| Manufacturing | -0.3% | -0.1% | -3.6% | -8.0% | 4.5% | 3.1% |

Tom Moeller
AuthorMore in Author Profile »Prior to joining Haver Analytics in 2000, Mr. Moeller worked as the Economist at Chancellor Capital Management from 1985 to 1999. There, he developed comprehensive economic forecasts and interpreted economic data for equity and fixed income portfolio managers. Also at Chancellor, Mr. Moeller worked as an equity analyst and was responsible for researching and rating companies in the economically sensitive automobile and housing industries for investment in Chancellor’s equity portfolio. Prior to joining Chancellor, Mr. Moeller was an Economist at Citibank from 1979 to 1984. He also analyzed pricing behavior in the metals industry for the Council on Wage and Price Stability in Washington, D.C. In 1999, Mr. Moeller received the award for most accurate forecast from the Forecasters' Club of New York. From 1990 to 1992 he was President of the New York Association for Business Economists. Mr. Moeller earned an M.B.A. in Finance from Fordham University, where he graduated in 1987. He holds a Bachelor of Arts in Economics from George Washington University.
More Economy in Brief


