Global| Apr 25 2005
ECRI Leading Index of U.S. Economy Flat to Down
by:Tom Moeller
|in:Economy in Brief
Summary
The Weekly Leading Index of the US economy from the Economic Cycle Research Institute (ECRI) edged up in the latest week but remained off the series' high reached roughly one month ago. The six month growth rate of 3.4% also declined [...]
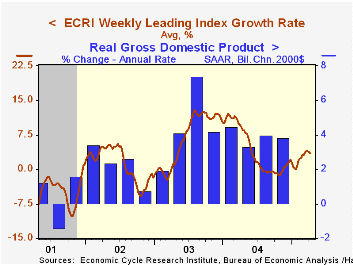
The Weekly Leading Index of the US economy from the Economic Cycle Research Institute (ECRI) edged up in the latest week but remained off the series' high reached roughly one month ago. The six month growth rate of 3.4% also declined from the high of 4.0%.
The latest week's up tick was due to declines in claims for jobless insurance and interest rates which were offset by lower stock prices.
During the last ten years there has been a 69% correlation between six-month growth in the ECRI leading index and two quarter growth in real U.S. GDP.
The components of the ECRI weekly leading index are money supply plus stock & bond mutual funds, the JOC-ECRI industrial materials price index, mortgage applications, bond quality spreads, stock prices, bond yields, and initial jobless insurance claims.
The ECRI Leading Index's recent pattern generally mirrors the Conference Board's Index of Leading Economic Indicators, with a slight lead. Construction of the ECRI Leading Index differs from the Conference Board Index but there has been a 70% correlation between the y/y percent change in the two series over the last 10 years.
The median lead of the ECRI index at business cycle peaks has been 10.5 months and at cycle troughs 3.0 months.
The latest from ECRI is available here.
| ECRI Leading Index | 04/15/05 | 04/08/05 | Growth Rate | 2004 | 2003 | 2002 |
|---|---|---|---|---|---|---|
| Weekly | 135.3 | 135.2 | 3.4% | 4.2% | 6.6% | 1.2% |
| Mar | Feb | |||||
| Monthly | 135.5 | 134.7 | 3.7% |
by Tom Moeller April 25, 2005

Sales of existing homes rose 1.0% in March to 6.890M versus Consensus expectations for sales of 6.78M.
Improved methodology, better modeling and the addition of condo & co-op sales affected the figures back to 1999. The data reflect closings of home sales in earlier months.
Single-family home sales increased 1.2% in March but remained 1-2% off last year's highs.
Single family home sales rose m/m across the country's regions. In the Northeast sales improved 1.2% (3.7% y/y) and in the Midwest sales rose 1.5% (2.2% y/y). Sales in the South increased 0.9% (5.4% y/y) and in the West sales rose 1.4% (5.7% y/y).
The median price of an existing single family home rose sharply m/m to $193,600 (+11.3% y/y).
The latest release from the National Association of Realtors is available here.
| Existing Home Sales (000, AR) | Mar | Feb | Y/Y | 2004 | 2003 | 2002 |
|---|---|---|---|---|---|---|
| Total Home Sales | 6,890 | 6,820 | 4.9% | 6,723 | 6,170 | 5,653 |
| Single Family Home Sales | 6,040 | 5,970 | 4.5% | 5,913 | 5,441 | 4,995 |
by Louise Curley April 25, 2005
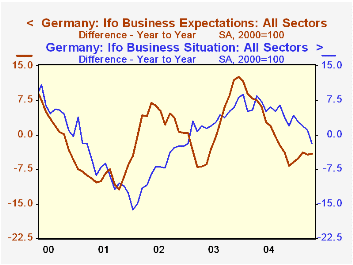
The IFO indexes of business conditions and expectations in Germany declined further in April as heralded by the ZEW indicator of market sentiment, released last week.
The respondents to thesurvey have become more pessimistic regarding their expectations than regarding their current conditions since April of 2004 as shown in the first chart where the year-to-year changes in expectations and current conditions are plotted.
Other confidence measures released recently include Belgium's BNB (Banque Nationale de Belgique) indicators of business and consumer confidence, both of which declined in April. The only bit of optimism, surprisingly, was shown in Italy's ISEA (Instituto Nationale de Statistica) index of consumer confidence which increased by 0.58% from March and 3.05% from April, 2004. The year-to-year changes in this measure are shown in the second chart together with the year-to-year changes in Belgium's measure of consumer confidence. Italy's consumers have, so far this year, shown positive changes from the corresponding months of 2004 while Belgium consumers have become negative.
| Euro-Zone countries: | Apr 05 | Mar 05 | Apr 04 | M/M % or Dif |
Y/Y % or Dif |
2004 | 2003 | 2002 |
|---|---|---|---|---|---|---|---|---|
| IFO Index (2000=100) Germany | ||||||||
| Business Climate | 93.3 | 94.0 | 96.4 | -0.74 | -3.22 | 95.7 | 91.7 | 89.4 |
| Business Conditions | 93.1 | 93.3 | 95.0 | -0.21 | -2.00 | 94.0 | 88.4 | 85.3 |
| Business Expectations | 93.6 | 94.6 | 97.8 | -1.06 | -4.29 | 97.4 | 95.1 | 93.8 |
| BNB % Balance Belgium | ||||||||
| Business Confidence | -11.6 | -8.0 | -0.6 | -3.6 | -12.2 | 2.3 | 12.9 | 7.9 |
| Consumer Confidence | -5 | -2 | -4 | -3 | -1 | -4 | -11 | -2 |
| ISEA (1980=100) Italy | ||||||||
| Consumer Confidence | 104.8 | 104.2 | 101.7 | 0.58 | 3.05 | 100.4 | 106.8 | 115.8 |

Tom Moeller
AuthorMore in Author Profile »Prior to joining Haver Analytics in 2000, Mr. Moeller worked as the Economist at Chancellor Capital Management from 1985 to 1999. There, he developed comprehensive economic forecasts and interpreted economic data for equity and fixed income portfolio managers. Also at Chancellor, Mr. Moeller worked as an equity analyst and was responsible for researching and rating companies in the economically sensitive automobile and housing industries for investment in Chancellor’s equity portfolio. Prior to joining Chancellor, Mr. Moeller was an Economist at Citibank from 1979 to 1984. He also analyzed pricing behavior in the metals industry for the Council on Wage and Price Stability in Washington, D.C. In 1999, Mr. Moeller received the award for most accurate forecast from the Forecasters' Club of New York. From 1990 to 1992 he was President of the New York Association for Business Economists. Mr. Moeller earned an M.B.A. in Finance from Fordham University, where he graduated in 1987. He holds a Bachelor of Arts in Economics from George Washington University.
More Economy in Brief