 Global| Jul 09 2007
Economy Watchers Index Edges Lower and Future Index Weakens
Summary
Economy watchers survey results are in the lower quarter or third of their respective five year ranges. The NTC Manufacturing survey is in the bottom one percentile of its range. Teikoku Results for Manufacturing are weakening, but [...]
Economy watchers survey results are in the lower quarter or third of their respective five year ranges. The NTC Manufacturing survey is in the bottom one percentile of its range. Teikoku Results for Manufacturing are weakening, but still stronger in relative terms, in the top third of their range
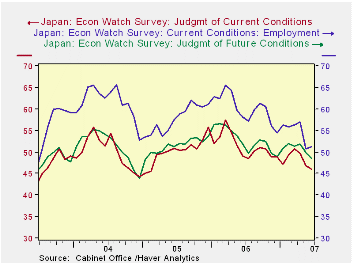
Japan is still having a hard time getting its economic traction. Its Economy Watchers Index fell in June and is further below 50; the future index fell below 50 for the first time in six months.
The NTC MFG index for Japan has been weak and sliding, as it has dropped for five months in a row. It was less weak than its current value in June of 2003.
The Teikoku indices are weighted diffusion readings, and the readings for MFG are even weaker than for the NTC barometer in absolute levels; but relative to its own range the reading is higher than for NTC. Still the Teikoku indices show a rapid drop in the sector readings in recent months. In the past three months various sectors have dropped 10 percentile points to 15 percentile to 20 percentile points (retailing) in terms of relative standings. Cleary Japan’s economy is having some difficulties and we see that in the exchange rate.
| Raw readings of each survey | Percent of 5Yr range* | ||||||
| Jun-07 | May-07 | Apr-07 | Mar-07 | Jun-07 | May-07 | Apr-07 | |
| Diffusion | |||||||
| Economy Watchers | 46.0 | 46.8 | 49.7 | 50.8 | 25.7% | 44.4% | 59.8% |
| Employment | 51.2 | 50.7 | 57.1 | 56.3 | 27.5% | 35.6% | 63.1% |
| Future | 48.4 | 50.0 | 51.9 | 51.3 | 34.9% | 52.9% | 68.0% |
| NTC MFG | 50.4 | 51.4 | 52.3 | 52.5 | 0.9% | 30.2% | 41.4% |
| Econ Trends (Teikoku'/50 neutral/weighted diffusion) | |||||||
| MFG | 44.6 | 45.2 | 47.0 | 47.2 | 69.7% | 76.2% | 85.1% |
| Retail | 39.2 | 39.6 | 41.1 | 41.1 | 52.7% | 64.3% | 74.3% |
| Wholesale | 42.1 | 42.8 | 44.3 | 44.6 | 68.0% | 75.6% | 83.5% |
| Services | 48.6 | 49.1 | 50.3 | 49.9 | 83.0% | 88.4% | 93.6% |
| Construction | 36.8 | 37.7 | 38.4 | 38.7 | 77.5% | 84.4% | 89.2% |
| 100 is high; Zero is low | |||||||
by Bob Brusca July 9, 2007
German industrial output rose a firm-looking 1.9% in May, but since that followed a 2.1% drop in April the results were not as expected and were disappointing. These two months follow a mild 0.2% rise in May. As a result in Q2 German IP is falling at a 4.5% annual rate two months into the new quarter. Who would expect with that with such strong orders growth, German IP could be poised to SUBTRACT from GDP in Q2? Well yes, some of the problem is construction and that is an old theme; but the weakness in IP has a broader base. Construction is off at a sharp 30% annual rate in the quarter. Capital goods and intermediate goods output each are off at about a 4% pace and only consumer goods output at +5.2% is up in the new quarter – so far.
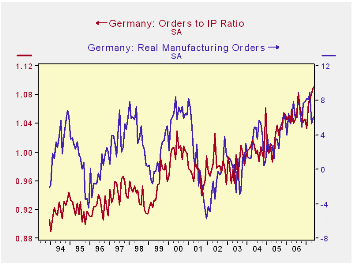
The chart plots IP growth vs orders as a ratio to IP. The ratio of Orders to IP does signal shifts in the growth rate of IP itself. That ratio has been on a long trend since early 2002. After a lull, it is back up strongly since February. However output, which is intrinsically volatile, has backed off in recent months as its growth has slowed. The order/IP ratio says that the pull back is temporary.
Meanwhile the facts show that IP growth rates have slowed sequentially, not just in the second quarter. That is true for the headline figure for capital goods output and for intermediate goods and for construction. Only consumer goods output is accelerating. Given orders strength we wonder if bottle necks are setting in. Does the ECB traditional inflation pressures have to worry about in Germany? Or is the IP pull back with growth still at 4.6% Yr/Yr simply normal fluctuation in a still strong and rising trend? Orders vs. output trends in Germany will bear watching to illuminate this issue.
| Saar exept m/m | May-07 | Apr-07 | Mar-07 | 3-mo | 6-mo | 12-mo |
| IP total | 1.9% | -2.1% | 0.2% | -0.3% | 2.3% | 4.6% |
| Consumer Goods | 1.6% | -1.1% | 1.7% | 9.0% | 2.0% | 1.3% |
| Capital Goods | 2.5% | -2.1% | -0.5% | -0.3% | 5.2% | 7.0% |
| Intermediate Goods | 2.3% | -2.9% | 1.0% | 1.3% | 6.1% | 7.6% |
| Memo | ||||||
| Auto | 0.3% | -4.9% | -7.4% | -39.2% | -14.9% | -3.0% |
by Louise Curley July 9, 2007
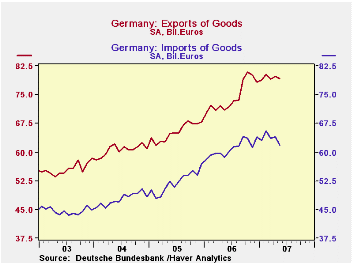
Germany's trade balance increased by 1.72 billion euros in May from April. Although exports declined by 0.56 billion euros, imports declined even more--2.28 billion euros. Exports reached a peak of 80.79 billion euros in October 2006. Since then, they have tended to fluctuate narrowly around a slightly lower level. Imports show a similar pattern, as can be seen in the first chart.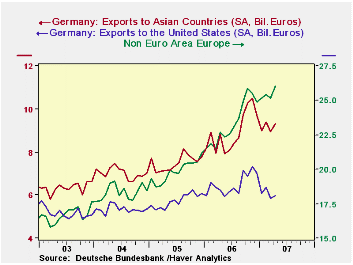
Much of Germany's trade is with its European neighbors, and of its neighbors, countries in the Euro Area are Germany's major trading partners. In 2006, German exports to the Euro Area accounted for 43% of total exports and imports from the Euro Area were 39% of total imports.Trading among these countries is unaffected by changes in the value of the euro.
The rise in the euro has, no doubt, dampened the demand for German exports in countries outside the Euro Area. As can be seen in the second chart, exports to the Non Euro Area fell sharply last fall. Since then, exports to the Non Euro Area of Europe have recovered more quickly than those to Asia and the United States. Data on trade by county are only available through April.
| GERMANY: TRADE IN GOODS ( Bil. Euros) | May 07 | Apr 07 | Mar 06 | Feb 06 | Jan 06 | 2006 | 2005 | 2004 |
|---|---|---|---|---|---|---|---|---|
| Exports | 79.27 | 79.83 | 79.08 | 80.27 | 78.83 | 893.85 | 783.73 | 726.66 |
| Imports | 61.71 | 63.99 | 63.48 | 65.60 | 63.03 | 731.61 | 625.91 | 572.67 |
| Balance | 15.56 | 15.84 | 15.60 | 14.67 | 15.80 | 162.24 | 157.82 | 153.99 |
| Export by Area | ||||||||
| Euro Area | -- | 34.61 | 34.61 | 34.83 | 34.27 | 660.47 | 580.01 | 538.73 |
| Non Euro Area Europe | -- | 26.05 | 25.17 | 25.44 | 25.17 | 280.36 | 238.40 | 220.06 |
| Asia | -- | 9.32 | 8.94 | 9.42 | 9.00 | 107.07 | 90.10 | 84.22 |
| United States | -- | 5.97 | 5.84 | 6.37 | 6.06 | 78.05 | 68.85 | 64.13 |

Robert Brusca
AuthorMore in Author Profile »Robert A. Brusca is Chief Economist of Fact and Opinion Economics, a consulting firm he founded in Manhattan. He has been an economist on Wall Street for over 25 years. He has visited central banking and large institutional clients in over 30 countries in his career as an economist. Mr. Brusca was a Divisional Research Chief at the Federal Reserve Bank of NY (Chief of the International Financial markets Division), a Fed Watcher at Irving Trust and Chief Economist at Nikko Securities International. He is widely quoted and appears in various media. Mr. Brusca holds an MA and Ph.D. in economics from Michigan State University and a BA in Economics from the University of Michigan. His research pursues his strong interests in non aligned policy economics as well as international economics. FAO Economics’ research targets investors to assist them in making better investment decisions in stocks, bonds and in a variety of international assets. The company does not manage money and has no conflicts in giving economic advice.
More Economy in Brief


